Free Access
Fig. 6
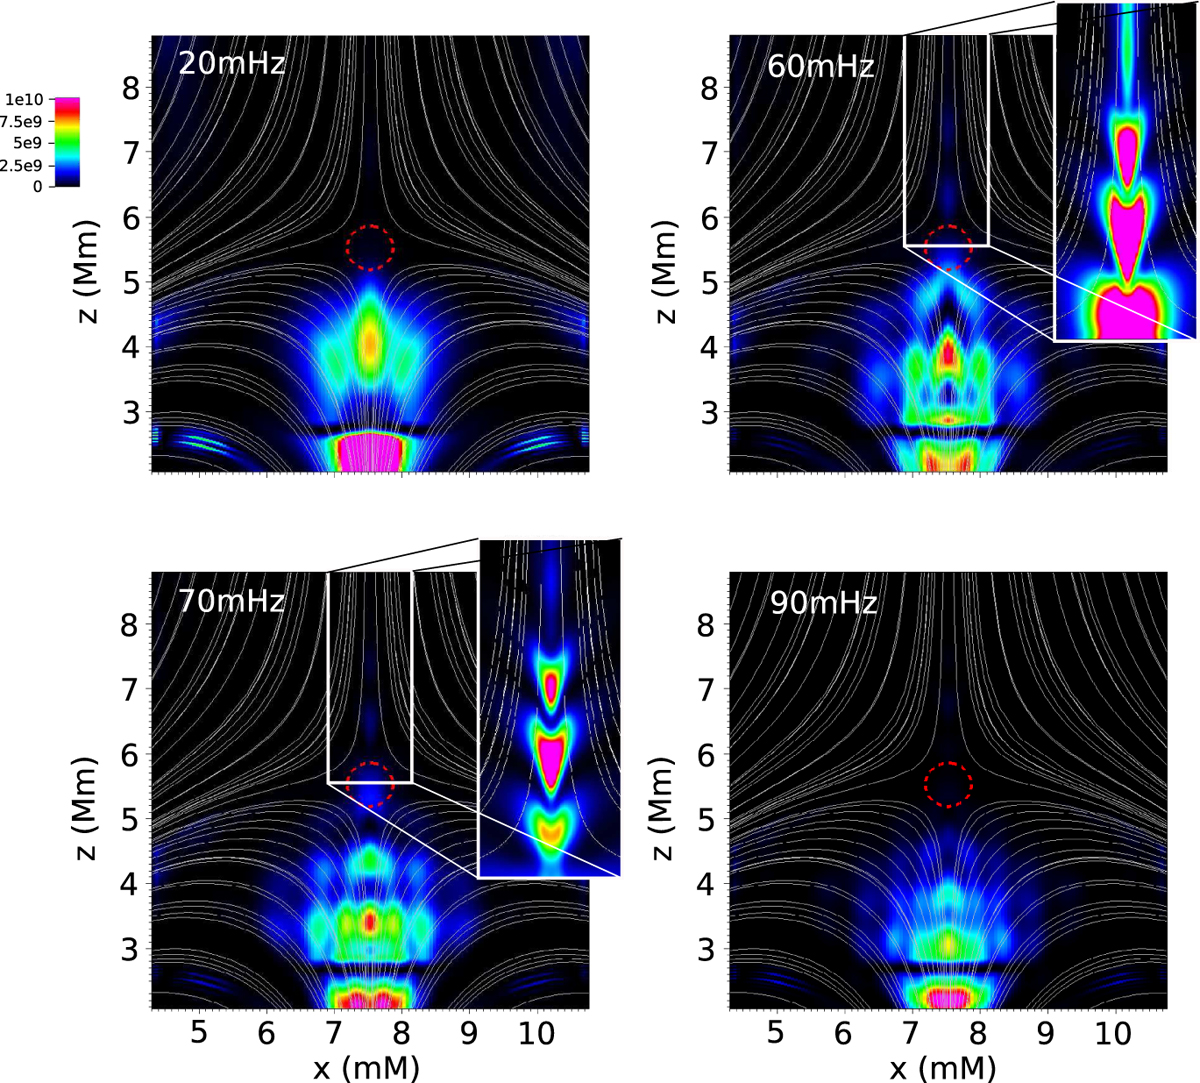
Spatial distributions of four different frequencies. The color map shows the frequency power. The overplotted light gray lines indicate the magnetic field lines and the dashed red contour shows the equipartition layer around the null point. The wave train was saturated in the prominent cases for a better visualization.
Current usage metrics show cumulative count of Article Views (full-text article views including HTML views, PDF and ePub downloads, according to the available data) and Abstracts Views on Vision4Press platform.
Data correspond to usage on the plateform after 2015. The current usage metrics is available 48-96 hours after online publication and is updated daily on week days.
Initial download of the metrics may take a while.