Fig. 9
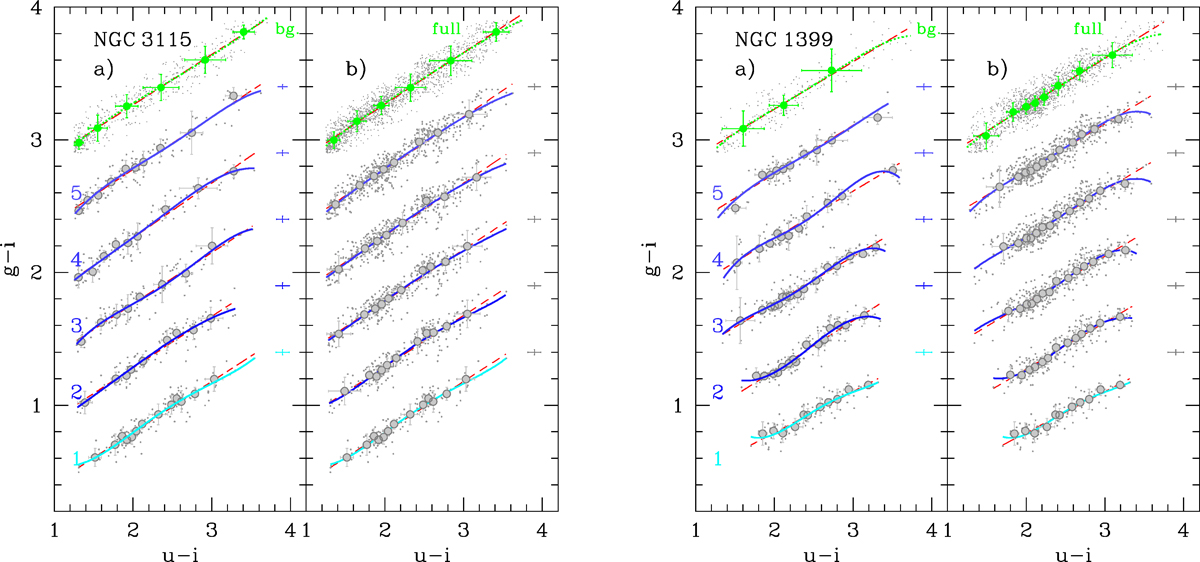
Left. Panel a: color–color relations fits for the GC candidates in the five annular regions analyzed in NGC 3115. The CCR for the innermost annulus is the lowermost. Single GC candidates are shown with dots; filled gray circlesmark the running median, with rms error bars derived using the maximum absolute deviation. The (g − i) of other annuliare shifted by multiples of +0.5 mag at increasing radii. Annuli are also labeled in the figure. Linear fits are shown with red dashed lines, polynomial fits with solid curves of different shades of blue. The uppermost fits show the CCRs ofbackground sources (red dashed and green-dotted line for linear and polynomial fits; bg label). The median color error for the sources used to derive the CCR fits is reported on the right of each fit. Panel b: as in panel a, except that the cumulative sample of candidates is taken within each radius (see text). The uppermost curves are obtained from the full sample of candidates. Right: as in left panels, but for NGC 1399.
Current usage metrics show cumulative count of Article Views (full-text article views including HTML views, PDF and ePub downloads, according to the available data) and Abstracts Views on Vision4Press platform.
Data correspond to usage on the plateform after 2015. The current usage metrics is available 48-96 hours after online publication and is updated daily on week days.
Initial download of the metrics may take a while.