Fig. 8
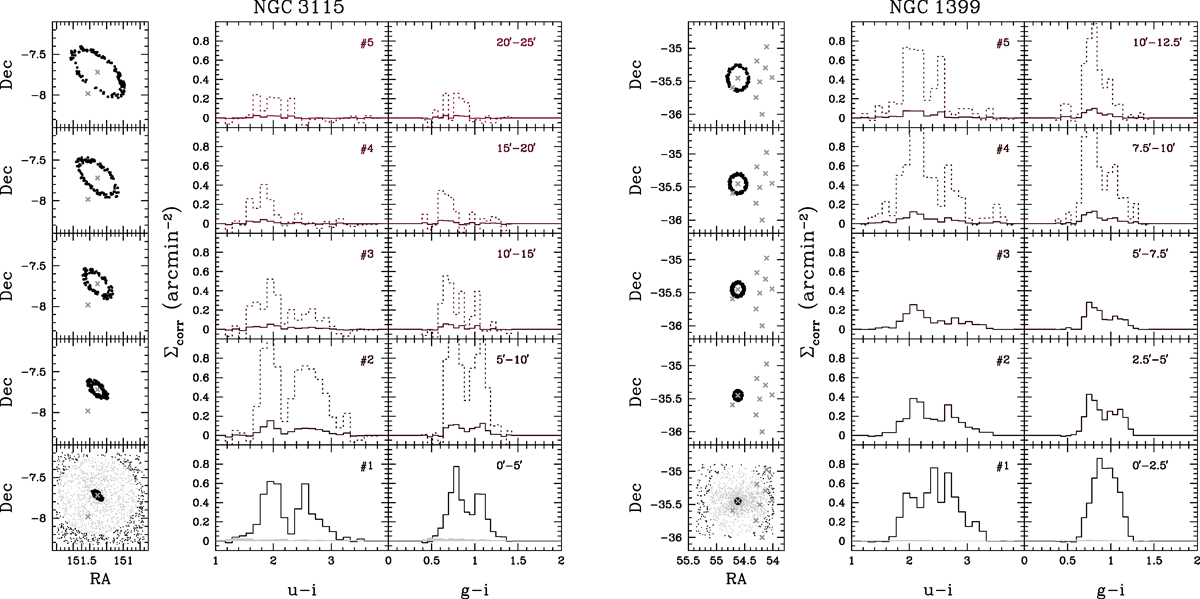
First column of panels from the left: position of GC candidates selected for color analysis. Each panel shows a different annular region, adopting the geometry of galaxy isophotes. In the lower panel we plot the full sample of selected GC candidates, adopting gray/black color for object within/outside the adopted background radius rbg = 29′. The gray crosses also indicate the centroid of NGC 3115 and its companion dwarf NGC 3115-DW01. Second column of panels: (u − i) surface density distribution of GCs, corrected for background, at different galactocentric radii (as shown in left panel, and labeled in right panels). Dotted lines show the density histograms with maximum density Σcorr < 0.2 multiplied by a factor of 10. The gray histogram in the lowermost plot refers to background sources. Third column of panels: as second, but for (g − i) color. Fourth to last column: as first three columns of panels, but for the GC candidates in the field around NGC 1399. The background radius adopted is rbg = 32′.
Current usage metrics show cumulative count of Article Views (full-text article views including HTML views, PDF and ePub downloads, according to the available data) and Abstracts Views on Vision4Press platform.
Data correspond to usage on the plateform after 2015. The current usage metrics is available 48-96 hours after online publication and is updated daily on week days.
Initial download of the metrics may take a while.