Fig. 7
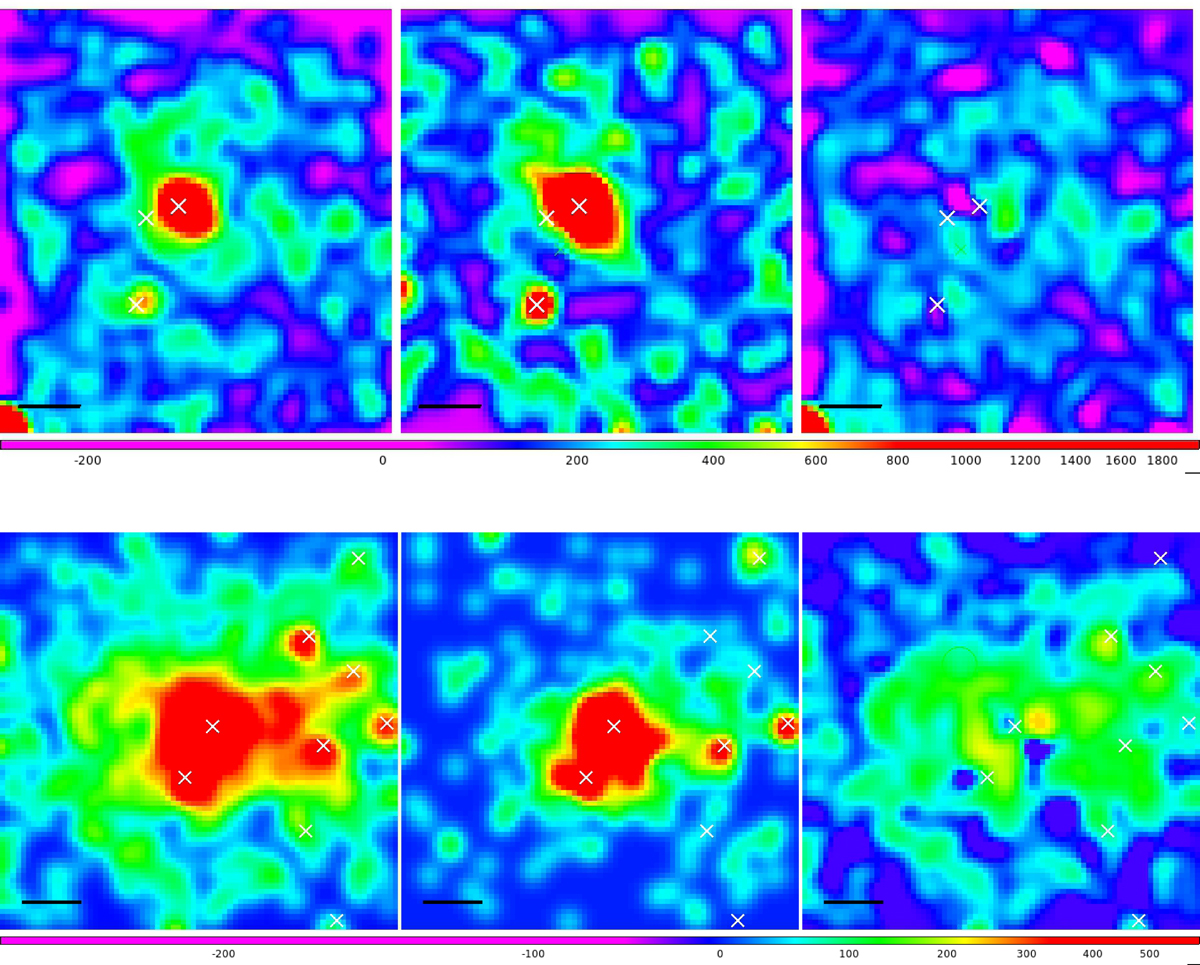
Upperleft and middle panels: GC density maps in NGC 3115 as in right panel of Fig. 6, except blue (left panel) and red (middle) GC candidates taken separately. Upper right panel: blue to red residual image (see text) is shown. Violet corresponds to zero level, red to highest counts. Lower panels: as in upper panels, but for GC candidates in the field of NGC 1399.
Current usage metrics show cumulative count of Article Views (full-text article views including HTML views, PDF and ePub downloads, according to the available data) and Abstracts Views on Vision4Press platform.
Data correspond to usage on the plateform after 2015. The current usage metrics is available 48-96 hours after online publication and is updated daily on week days.
Initial download of the metrics may take a while.