Fig. 6
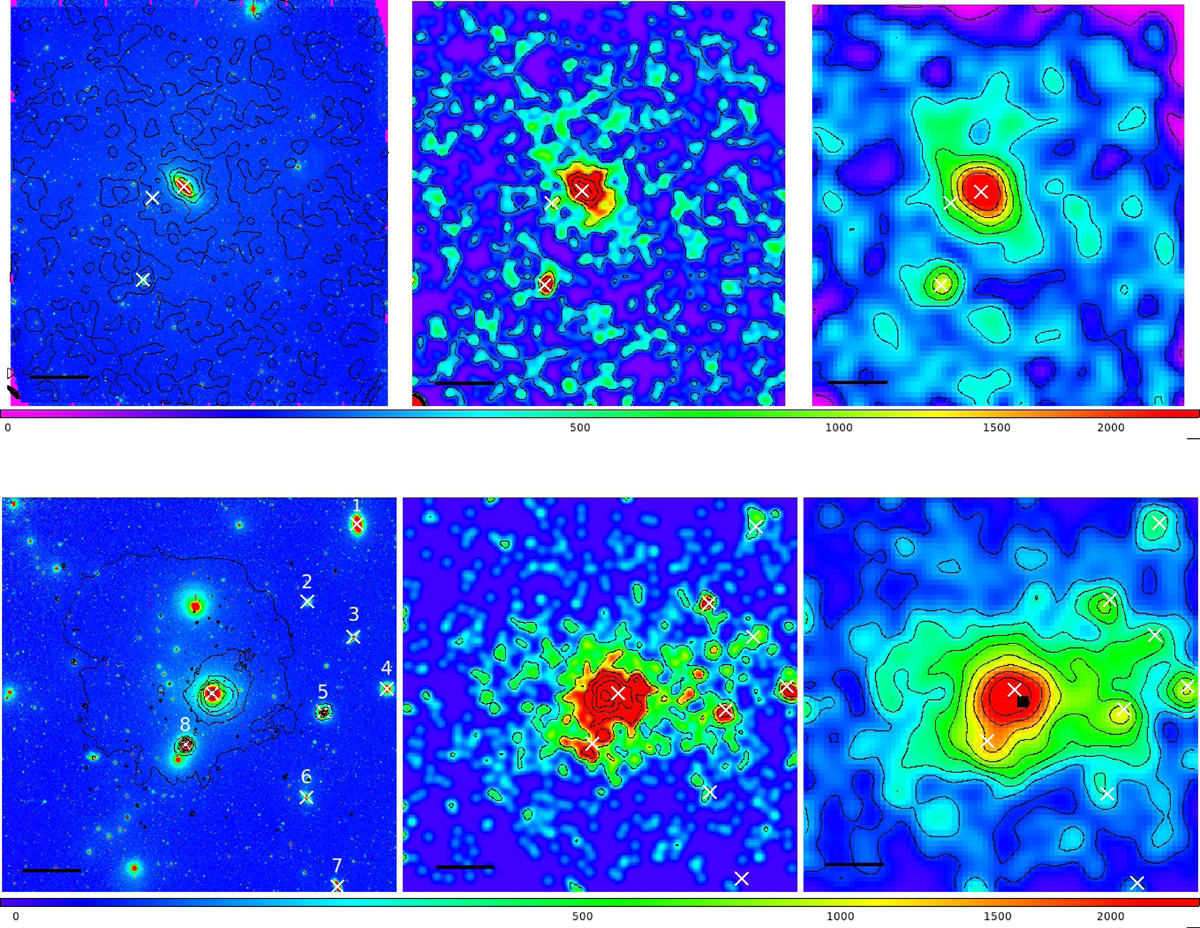
Upper left panel: g band image of NGC 3115 overlaid with contour levels derived from the GC density maps (from the 21′′ × 21′′ grid map, see text). East is left, north is up. The white crosses indicate the position of NGC 3115, NGC 3115-DW01 (~ 17′ southeast of NGC 3115), and KK 084 (~5.5′ east). Upper middle panel: density maps of GC candidates obtained from counting GCs in cells 21′′ each side are shown. Violet corresponds to zero level and red to highest counts, as indicatedby the color bar. Density contours are also shown with black solid lines. Upper right panel: as middle panel, except that the grid spacing for GCs counting is 52.5′′ in this case. The black bar to the lower left of the panels corresponds to 10′ length. Lower panels: as upper panels, but for NGC 1399. In the left panel the X-ray contour map is overlaid on the g-band image, instead of the GC isodensity contours as for NGC 3115. The black square in the lower right panel shows the centroid of the density distribution within isodensity radius ~ 25′ . The numbers in the left panel indicate, respectively, #1 ≡ NGC 1380, #2 ≡ NGC 1382, #3 ≡ NGC 1381, #4 ≡ NGC 1379, #5 ≡ NGC 1387, #6 ≡ NGC 1389, #7 ≡ NGC 1386, and #8 ≡ NGC 1404.
Current usage metrics show cumulative count of Article Views (full-text article views including HTML views, PDF and ePub downloads, according to the available data) and Abstracts Views on Vision4Press platform.
Data correspond to usage on the plateform after 2015. The current usage metrics is available 48-96 hours after online publication and is updated daily on week days.
Initial download of the metrics may take a while.