Fig. 11
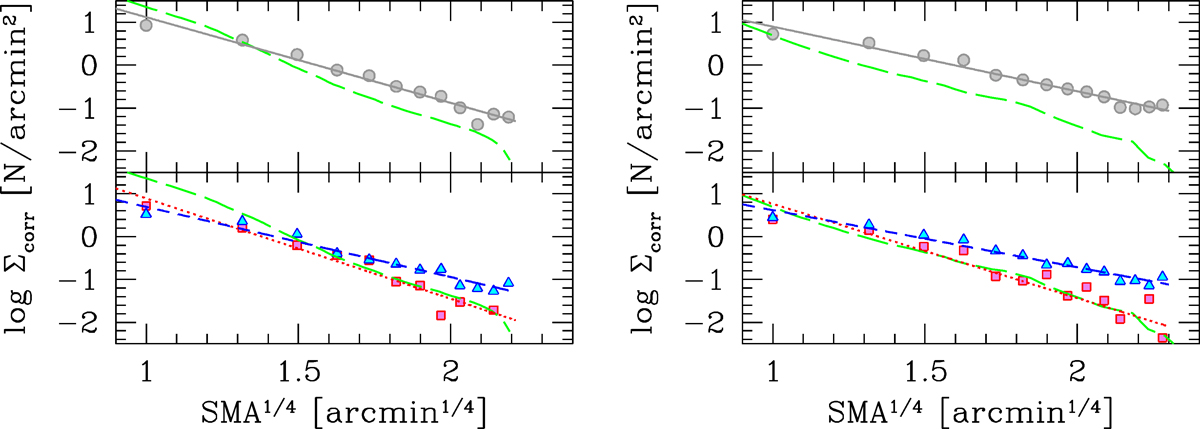
Upper left panel: surface density of GC candidates in NGC 3115, corrected for background contamination, vs. galaxy semimajor axis length, SMA. The binned data are shown with gray circles, the r1∕4 law is fit with a solid line. The green long-dashed line denotes the g-band light profile from Spavone et al. (in prep.), arbitrarily scaled vertically to match the red GC density profile. Lower left panel: as upper, but separately for blue GCs (blue triangles and dashed line) and red GCs (red squares and dotted line). Right panels: as left, but for the GCs in NGC 1399.
Current usage metrics show cumulative count of Article Views (full-text article views including HTML views, PDF and ePub downloads, according to the available data) and Abstracts Views on Vision4Press platform.
Data correspond to usage on the plateform after 2015. The current usage metrics is available 48-96 hours after online publication and is updated daily on week days.
Initial download of the metrics may take a while.