Fig. 10
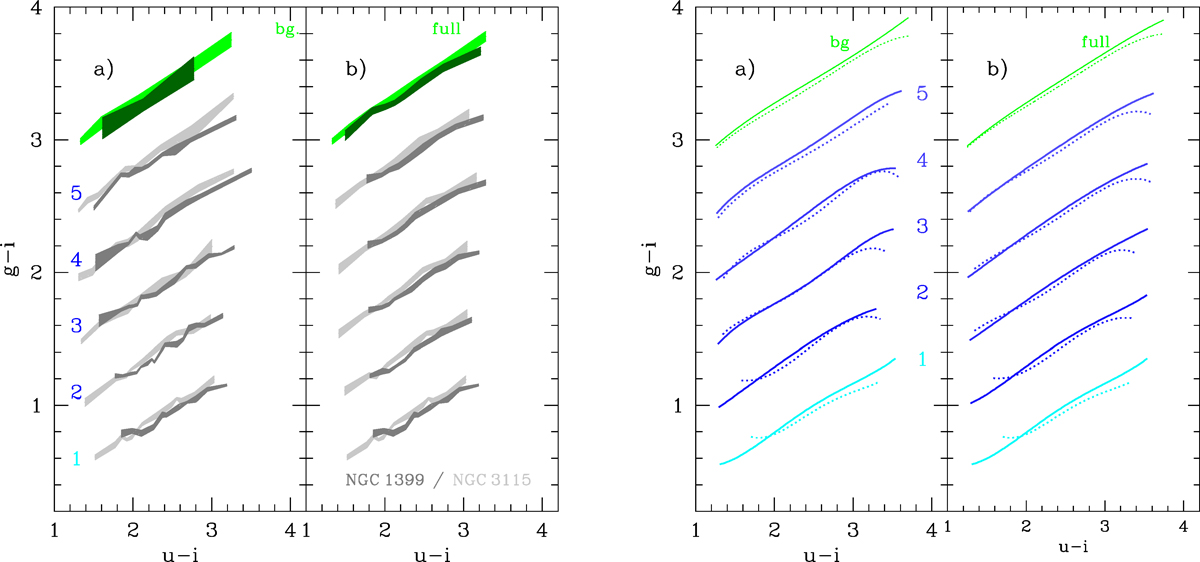
Left panel: as in Fig. 9, except that both galaxies are plotted together and only the areas identified by the running median are shown. The width of the shaded areas is given by the standard deviation of the mean. Darker colors refer to NGC 1399; light gray and green to NGC 3115. Right panel: as in Fig. 9, except that the polynomial fits for the CCRs of NGC 3115 (solid lines) are superposed on NGC 1399 (dotted lines).
Current usage metrics show cumulative count of Article Views (full-text article views including HTML views, PDF and ePub downloads, according to the available data) and Abstracts Views on Vision4Press platform.
Data correspond to usage on the plateform after 2015. The current usage metrics is available 48-96 hours after online publication and is updated daily on week days.
Initial download of the metrics may take a while.