Fig. 1
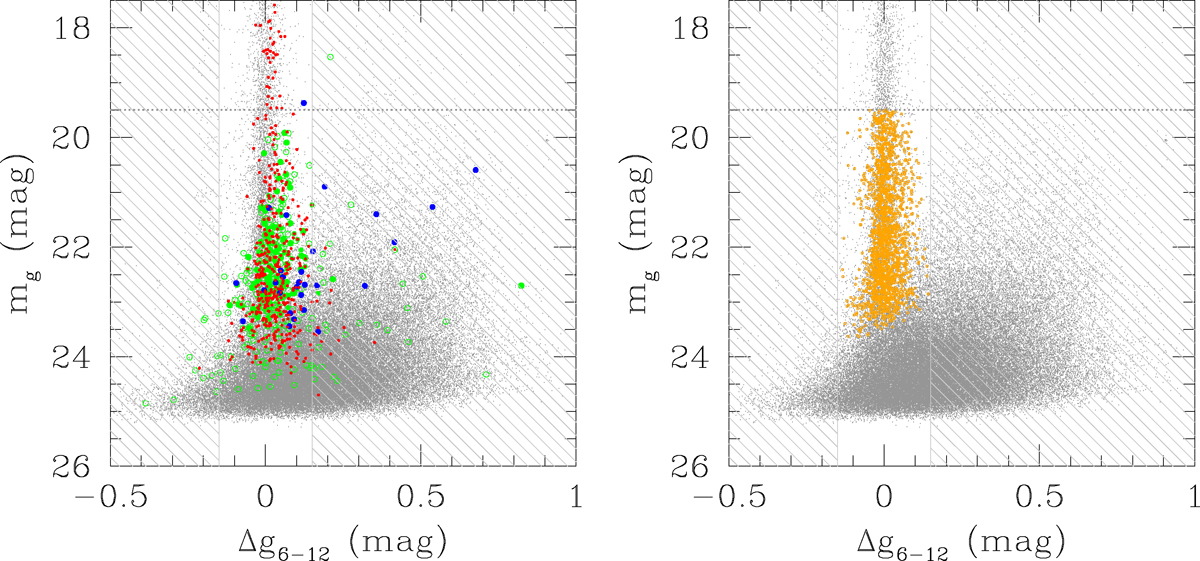
Left panel: g magnitude vs. concentration index (Δg6−12 ≡ g6pix − g12pix) for the full ugi matched sample (in gray) in NGC 3115. Spectroscopic confirmed GCs are shown with green filled circles (from Arnold et al. 2011)and photometric confirmed GCs from ACS are shown with empty green circles (from Jennings et al. 2014). Blue circles indicate UCDs from Jennings et al. (2014). Red dots indicate confirmed stars from both the spectroscopic and ACS studies cited. The gray hatched area shows the regions of sources rejected based on the concentration index selection. The horizontal dotted line indicates the bright magnitude cut. Right panel: as left panel, except that GC candidates before color–color selection are shown with orange empty circles.
Current usage metrics show cumulative count of Article Views (full-text article views including HTML views, PDF and ePub downloads, according to the available data) and Abstracts Views on Vision4Press platform.
Data correspond to usage on the plateform after 2015. The current usage metrics is available 48-96 hours after online publication and is updated daily on week days.
Initial download of the metrics may take a while.