Free Access
Fig. 6
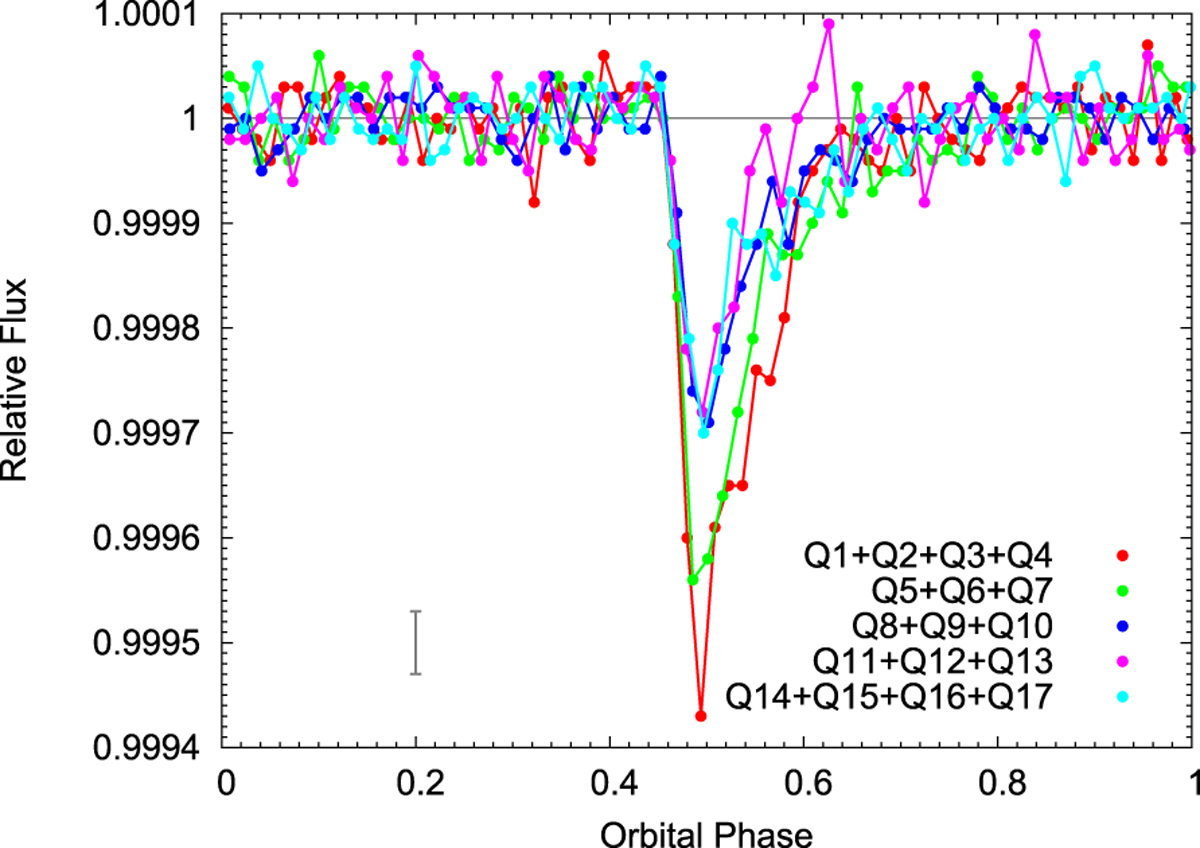
Transit depth decreasing at KOI 2700b. The phase-folded and binned transit light curves of the exoplanet were constructed from 3 and 4 quarters (Q) of detrended data. The illustrative vertical error bar on the left side represents the median uncertainty of all data points.
Current usage metrics show cumulative count of Article Views (full-text article views including HTML views, PDF and ePub downloads, according to the available data) and Abstracts Views on Vision4Press platform.
Data correspond to usage on the plateform after 2015. The current usage metrics is available 48-96 hours after online publication and is updated daily on week days.
Initial download of the metrics may take a while.