Free Access
Fig. 4
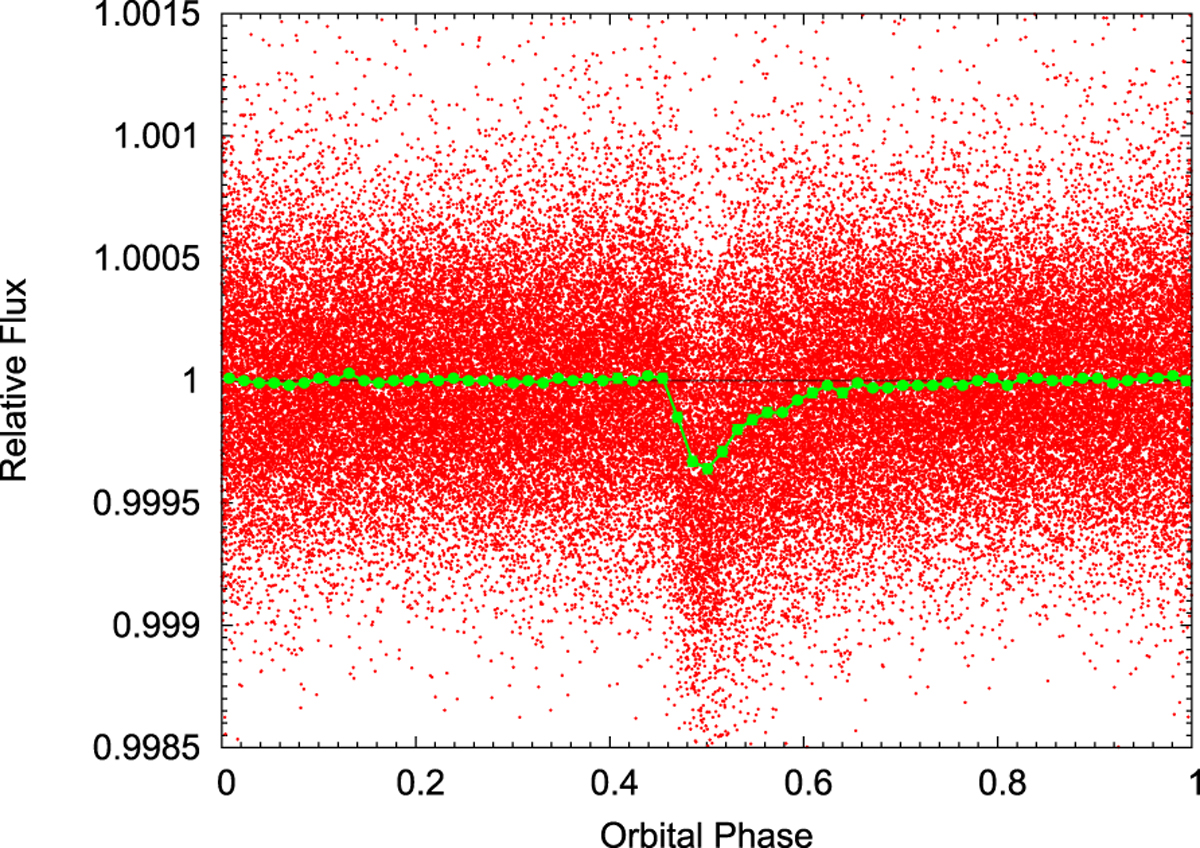
Phase-folded and binned transit light curve of KOI 2700b. Red points are observations and green points represent the averaged data. We note that averaged data points have uncertainties that are too small to be discerned in this plot. Error bars of these data are well depicted, for example, in Fig 9.
Current usage metrics show cumulative count of Article Views (full-text article views including HTML views, PDF and ePub downloads, according to the available data) and Abstracts Views on Vision4Press platform.
Data correspond to usage on the plateform after 2015. The current usage metrics is available 48-96 hours after online publication and is updated daily on week days.
Initial download of the metrics may take a while.