Fig. 3
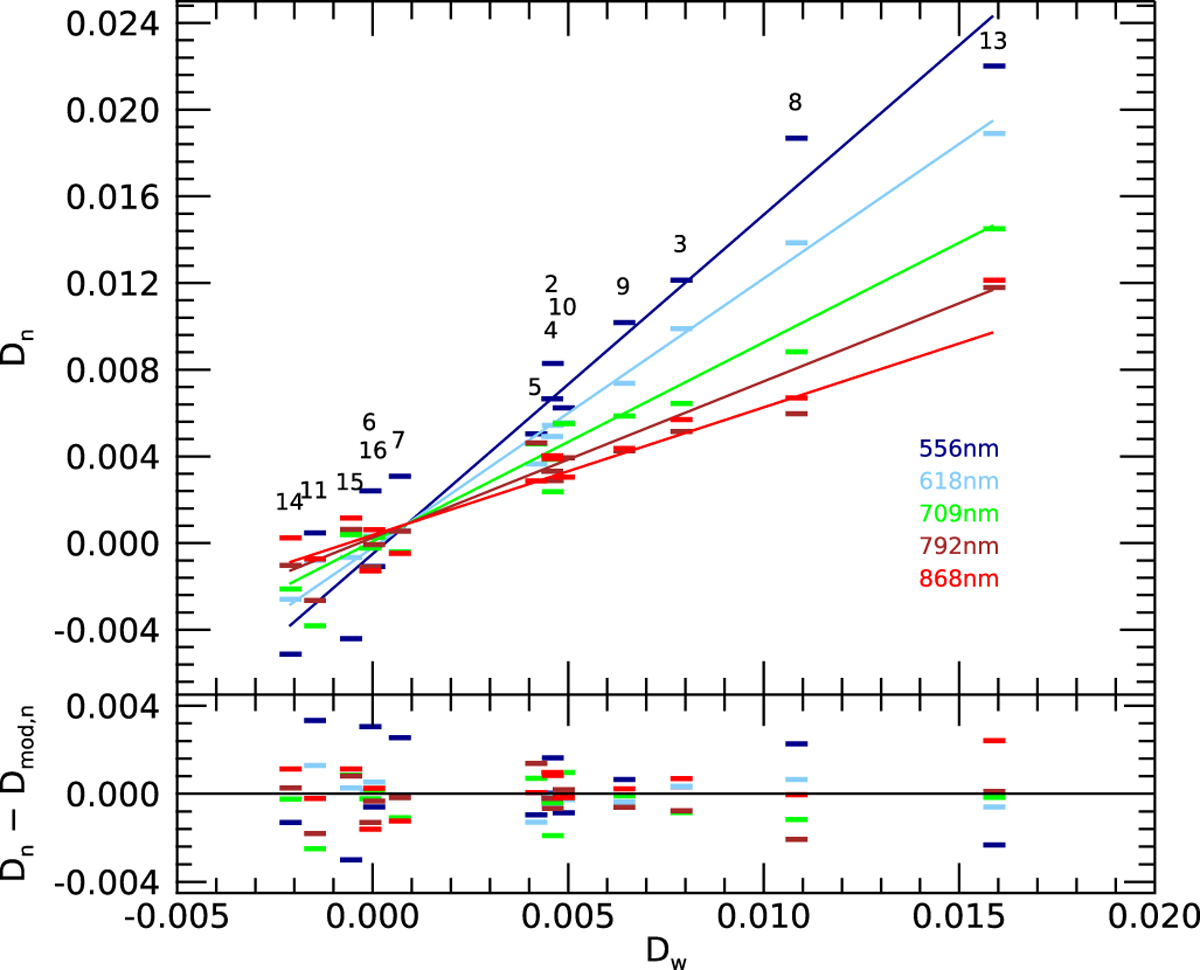
Measured depths Dn in the five colour bands, indicated by the same colours as in Fig. 2, vs. the white (average) depths Dw for the 14 pointings that were analysed. The straight lines indicate the joint fit to all bands, with the best common value for the AAC of α = 2.19. The lower panel shows the residuals on the same scale. Error bars are omitted for clarity.
Current usage metrics show cumulative count of Article Views (full-text article views including HTML views, PDF and ePub downloads, according to the available data) and Abstracts Views on Vision4Press platform.
Data correspond to usage on the plateform after 2015. The current usage metrics is available 48-96 hours after online publication and is updated daily on week days.
Initial download of the metrics may take a while.