Fig. 1
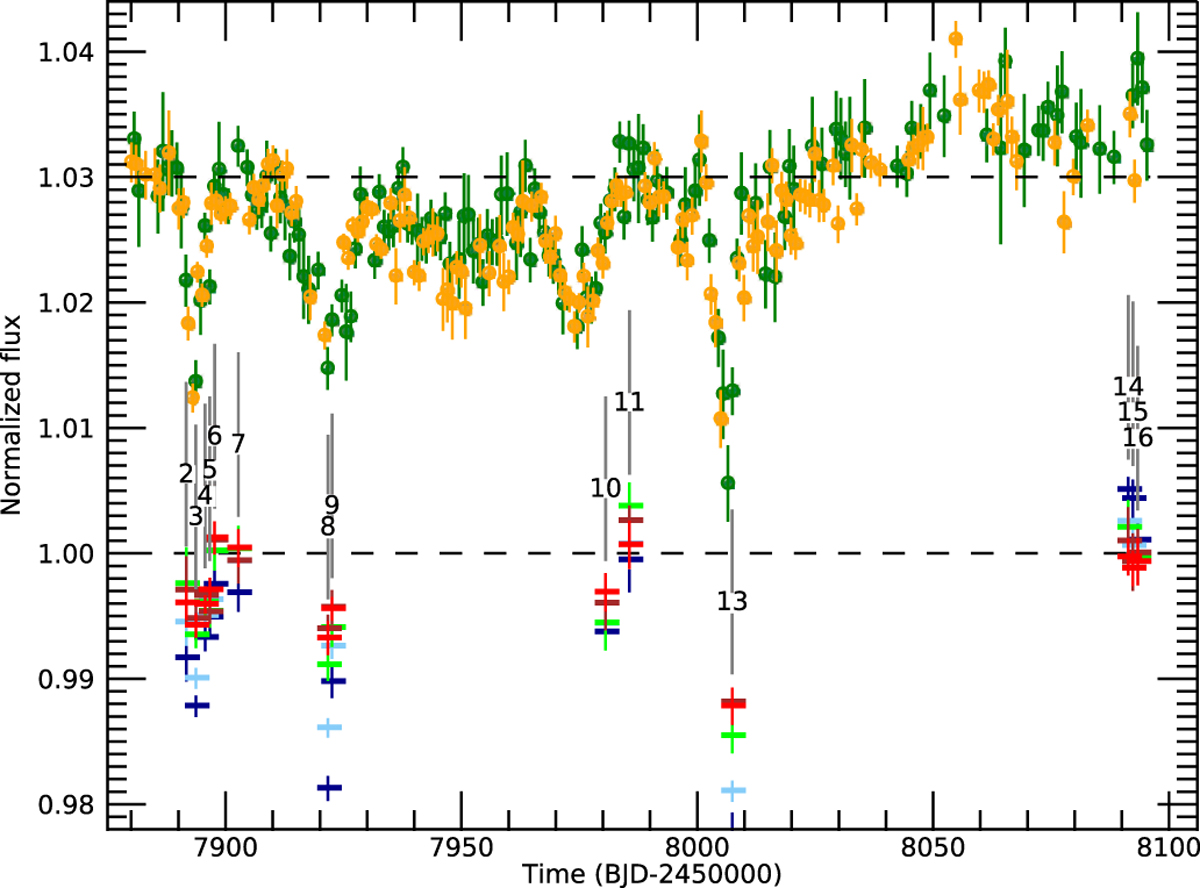
Normalised fluxes of KIC 8462852 from May 6 to December 8, 2017, from the LCO and GTC. The upper light curve shows nightly photometry in the r′ filter from the 0.4 m LCO telescopes in Tenerife (green) and Hawaii (orange), shifted upwards by 0.03 flux units for clearer display. The assumed quiescent flux is indicated by the dashed line. The lower symbols show the corresponding GTC narrow-band fluxes with their errors. The crosses’ colours correspond to the wavelength ranges indicated by Fig. 2. The vertical lines indicate the time of each numbered pointing. We only show the 14 pointings used in the analysis.
Current usage metrics show cumulative count of Article Views (full-text article views including HTML views, PDF and ePub downloads, according to the available data) and Abstracts Views on Vision4Press platform.
Data correspond to usage on the plateform after 2015. The current usage metrics is available 48-96 hours after online publication and is updated daily on week days.
Initial download of the metrics may take a while.