Fig. 3
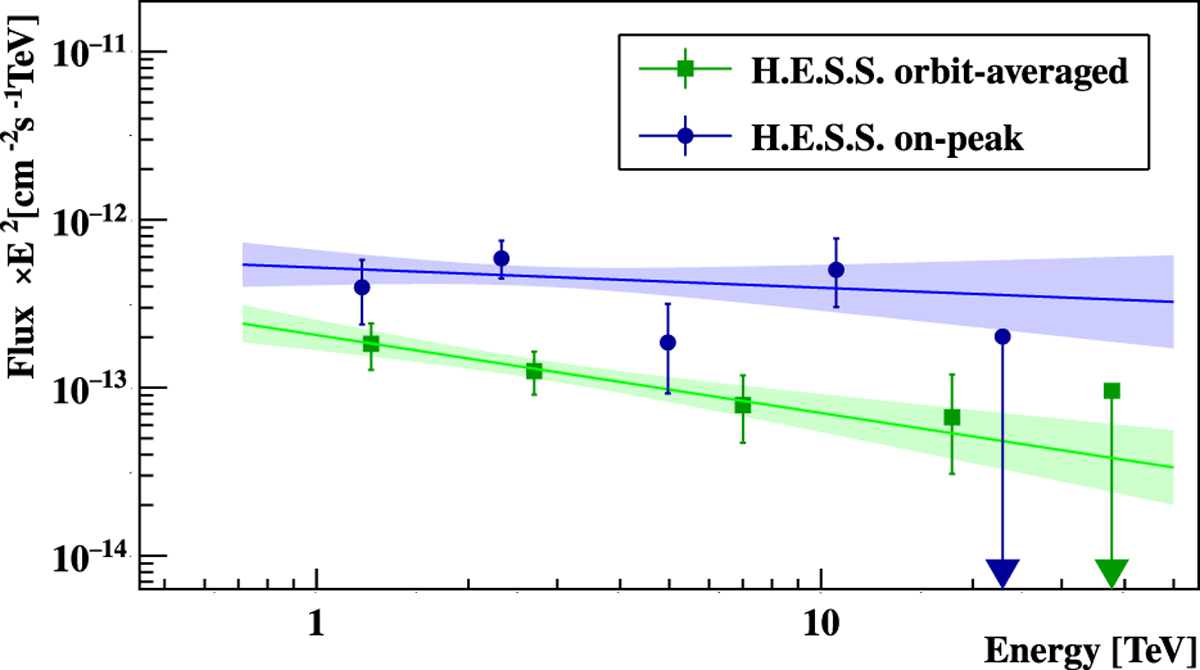
Spectral energy distribution averaged over the fullorbit (green, squares) and for the on-peak orbital phase range (orbital phase from 0.2 to 0.4: blue, circles). The data points have 1 σ statistical error bars, upper limits are for a 95% confidence level. The best fit and its uncertainty are represented by the solid lines and shaded areas, respectively.
Current usage metrics show cumulative count of Article Views (full-text article views including HTML views, PDF and ePub downloads, according to the available data) and Abstracts Views on Vision4Press platform.
Data correspond to usage on the plateform after 2015. The current usage metrics is available 48-96 hours after online publication and is updated daily on week days.
Initial download of the metrics may take a while.