Fig. 2
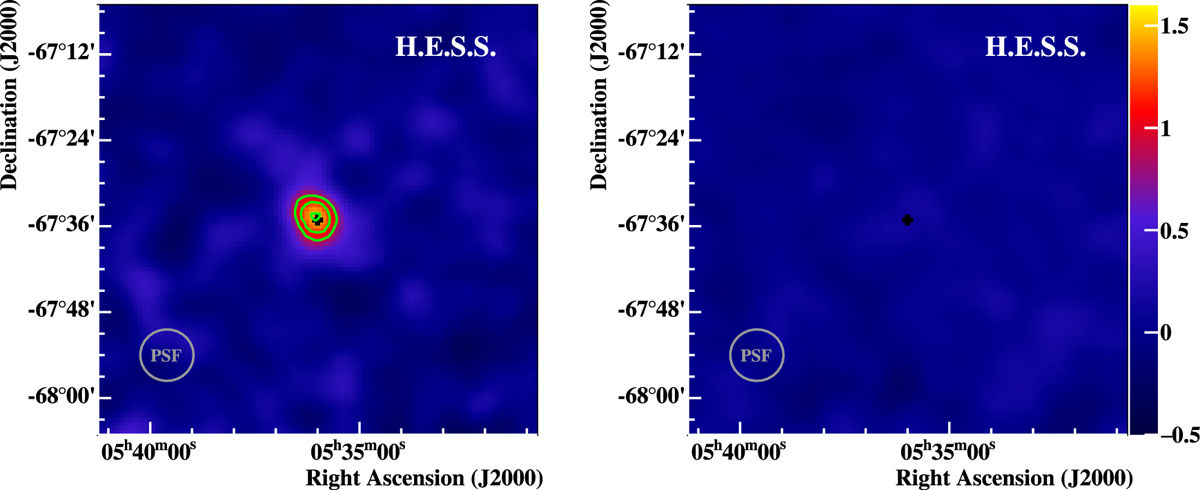
H.E.S.S. excess count rate maps for the on-peak (left panel) and off-peak (right panel) regions of the orbit. Theexcess is smoothed with the point-spread function of the instrument (68% containment radius of 0.06∘ , indicated by the grey circle) . The cross indicates the test position. Both plots have the same range, and the colour bar on the right-hand side is in units of excess counts per hour. The overlaid green contours represent 4, 5, and 6 σ statistical significance.
Current usage metrics show cumulative count of Article Views (full-text article views including HTML views, PDF and ePub downloads, according to the available data) and Abstracts Views on Vision4Press platform.
Data correspond to usage on the plateform after 2015. The current usage metrics is available 48-96 hours after online publication and is updated daily on week days.
Initial download of the metrics may take a while.