Fig. 1
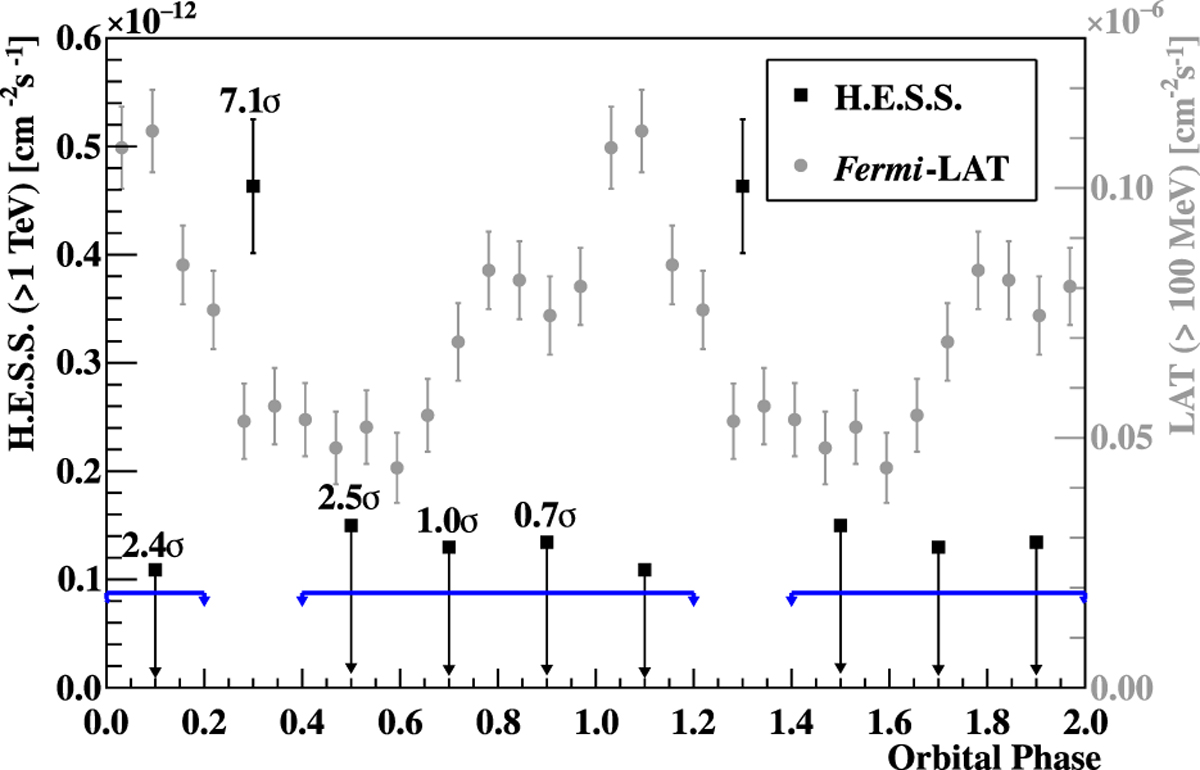
Folded γ-ray light curves with orbital phase zero at the maximum of the HE γ-ray emission (MJD 57 410.25). For better readability two orbits are shown. The black points (left y-axis) represent the VHE light curve (this work), the grey points (right y-axis) representthe HE light curve (from Corbet et al. 2016, Fig. 3). Error bars represent 1 σ statistical uncertainty. For the phase bins without significant detection, upper limits (at 95% confidence level) are given. The labels at the data points indicate the statistical significance of the excess in each phase bin. The blue horizontal lines denote the upper limit (at 95% confidence level) on the flux in the off-peak region (orbital phase 0.4 to 1.2).
Current usage metrics show cumulative count of Article Views (full-text article views including HTML views, PDF and ePub downloads, according to the available data) and Abstracts Views on Vision4Press platform.
Data correspond to usage on the plateform after 2015. The current usage metrics is available 48-96 hours after online publication and is updated daily on week days.
Initial download of the metrics may take a while.