Fig. 3
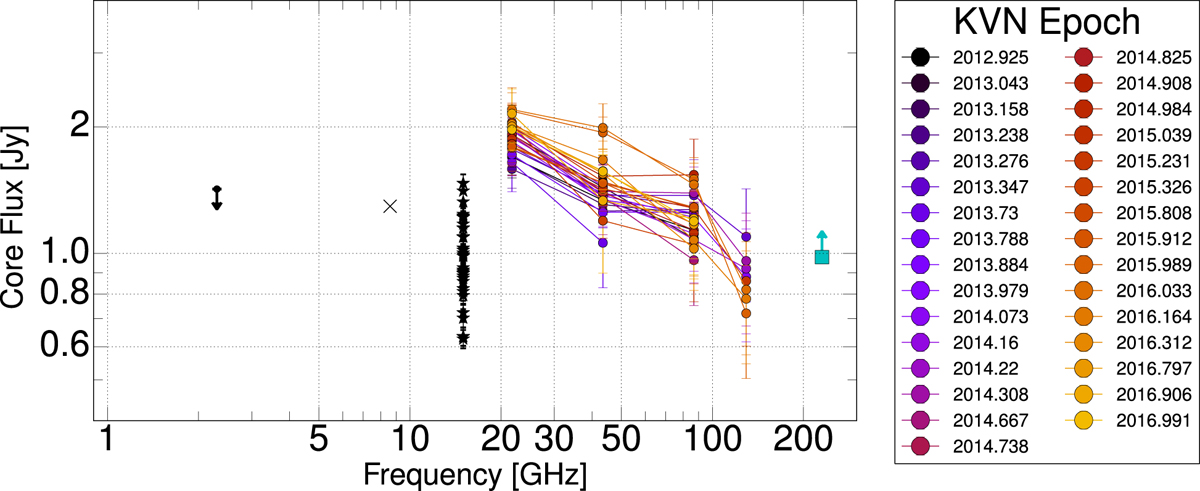
Radio spectrum of the M 87 core region in log-log scale. Different KVN observing epochs are indicated by different colors in the legend. The arrows indicate upper and lower limits. References of other multi-frequency flux information (in order of increasing radio frequency): Pushkarev & Kovalev (2012); Lister et al. (2016); Doeleman et al. (2012); Akiyama et al. (2015).
Current usage metrics show cumulative count of Article Views (full-text article views including HTML views, PDF and ePub downloads, according to the available data) and Abstracts Views on Vision4Press platform.
Data correspond to usage on the plateform after 2015. The current usage metrics is available 48-96 hours after online publication and is updated daily on week days.
Initial download of the metrics may take a while.