Fig. 2
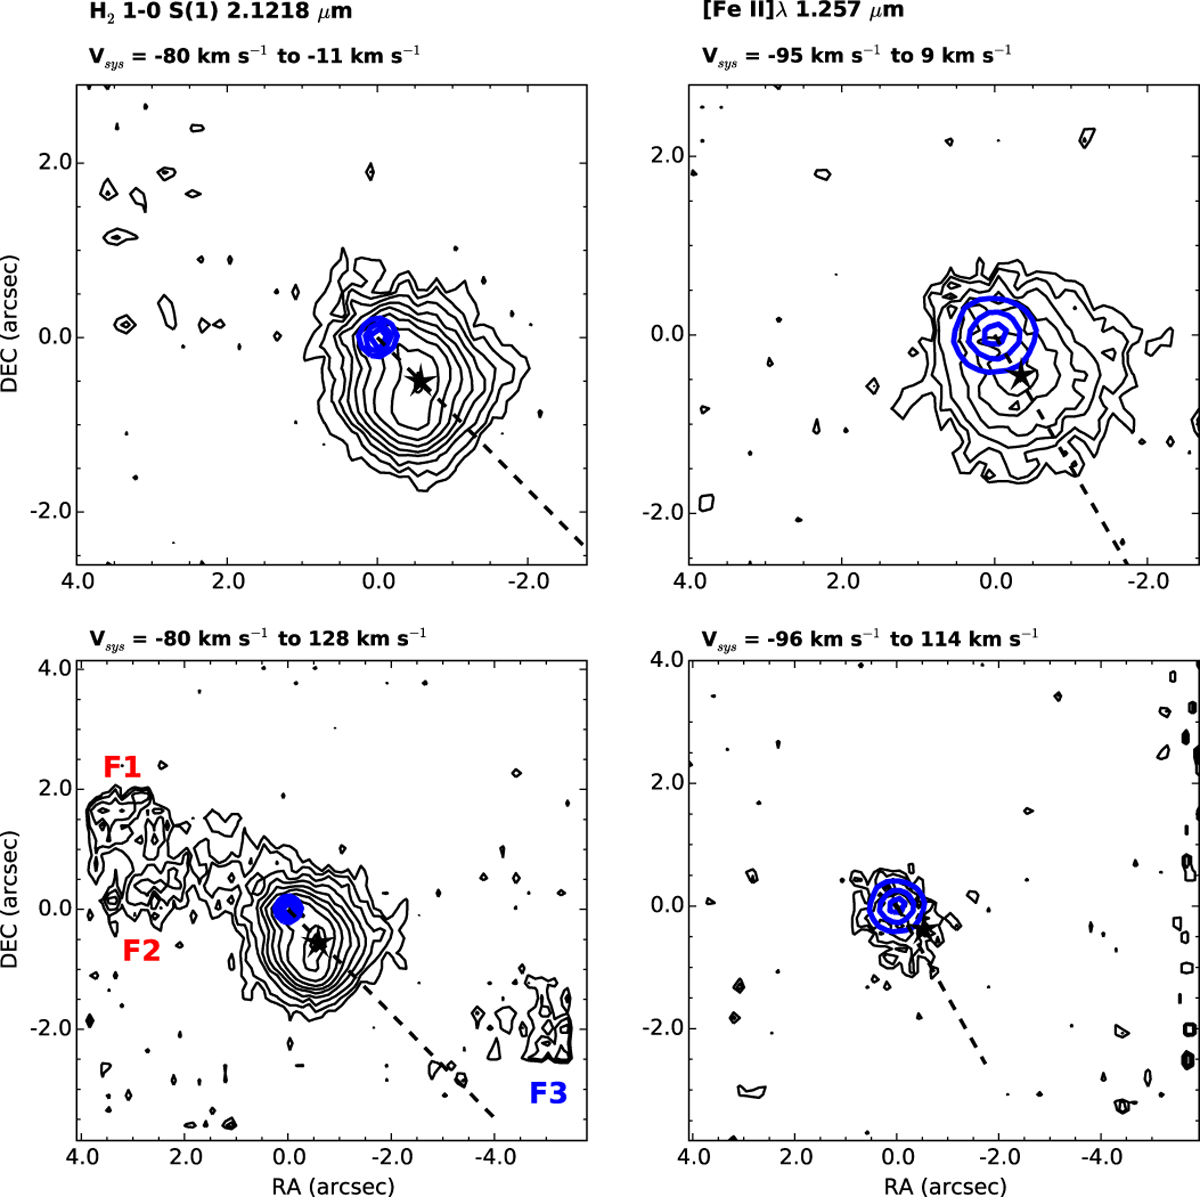
Continuum subtracted spectro-images of the ISO-Oph 200 outflow in the H2 1-0S(1) and [Fe II] 1.257 μm lines. Velocities have been corrected for the systemic velocity of the source. Top panels: here the emission in a mainly blue-shifted velocity range is shown to highlight the blue-shifted jet emission only. Black contours begin at 3σ and increase in multiples of 1.5. 1σ = 4.5 × 10⁻¹⁵ erg cm−2 s−1 μm−1. The blue contours show the continuum emission and they correspond to 50%, 75%, and 95% of the peak flux of the continuum. The black stars marks the position of the emission peaks and the emission PA is delineated by the dashed line. Bottom panels: here the emission in the velocity ranges –80 km s−1 to 128 km s−1 (H2 ) and –96 km s−1 to 114 km s−1 ([Fe II]) is shown. This range was chosen to show simultaneously the extended blue and red-shifted low velocity H2 emission which it is argued traces the cavity. The chosen range also shows that there is no red-shifted counterpart to the blue-shifted jet emission and that the cavity emission is not seen in [Fe II]. Contours start at 3σ and increase in multiples of 1.5. 1σ = 5 × 10⁻¹⁵ erg cm−2 s−1 μm−1. The continuum emission is plotted in the same way as for the top panels.
Current usage metrics show cumulative count of Article Views (full-text article views including HTML views, PDF and ePub downloads, according to the available data) and Abstracts Views on Vision4Press platform.
Data correspond to usage on the plateform after 2015. The current usage metrics is available 48-96 hours after online publication and is updated daily on week days.
Initial download of the metrics may take a while.