Fig. 4
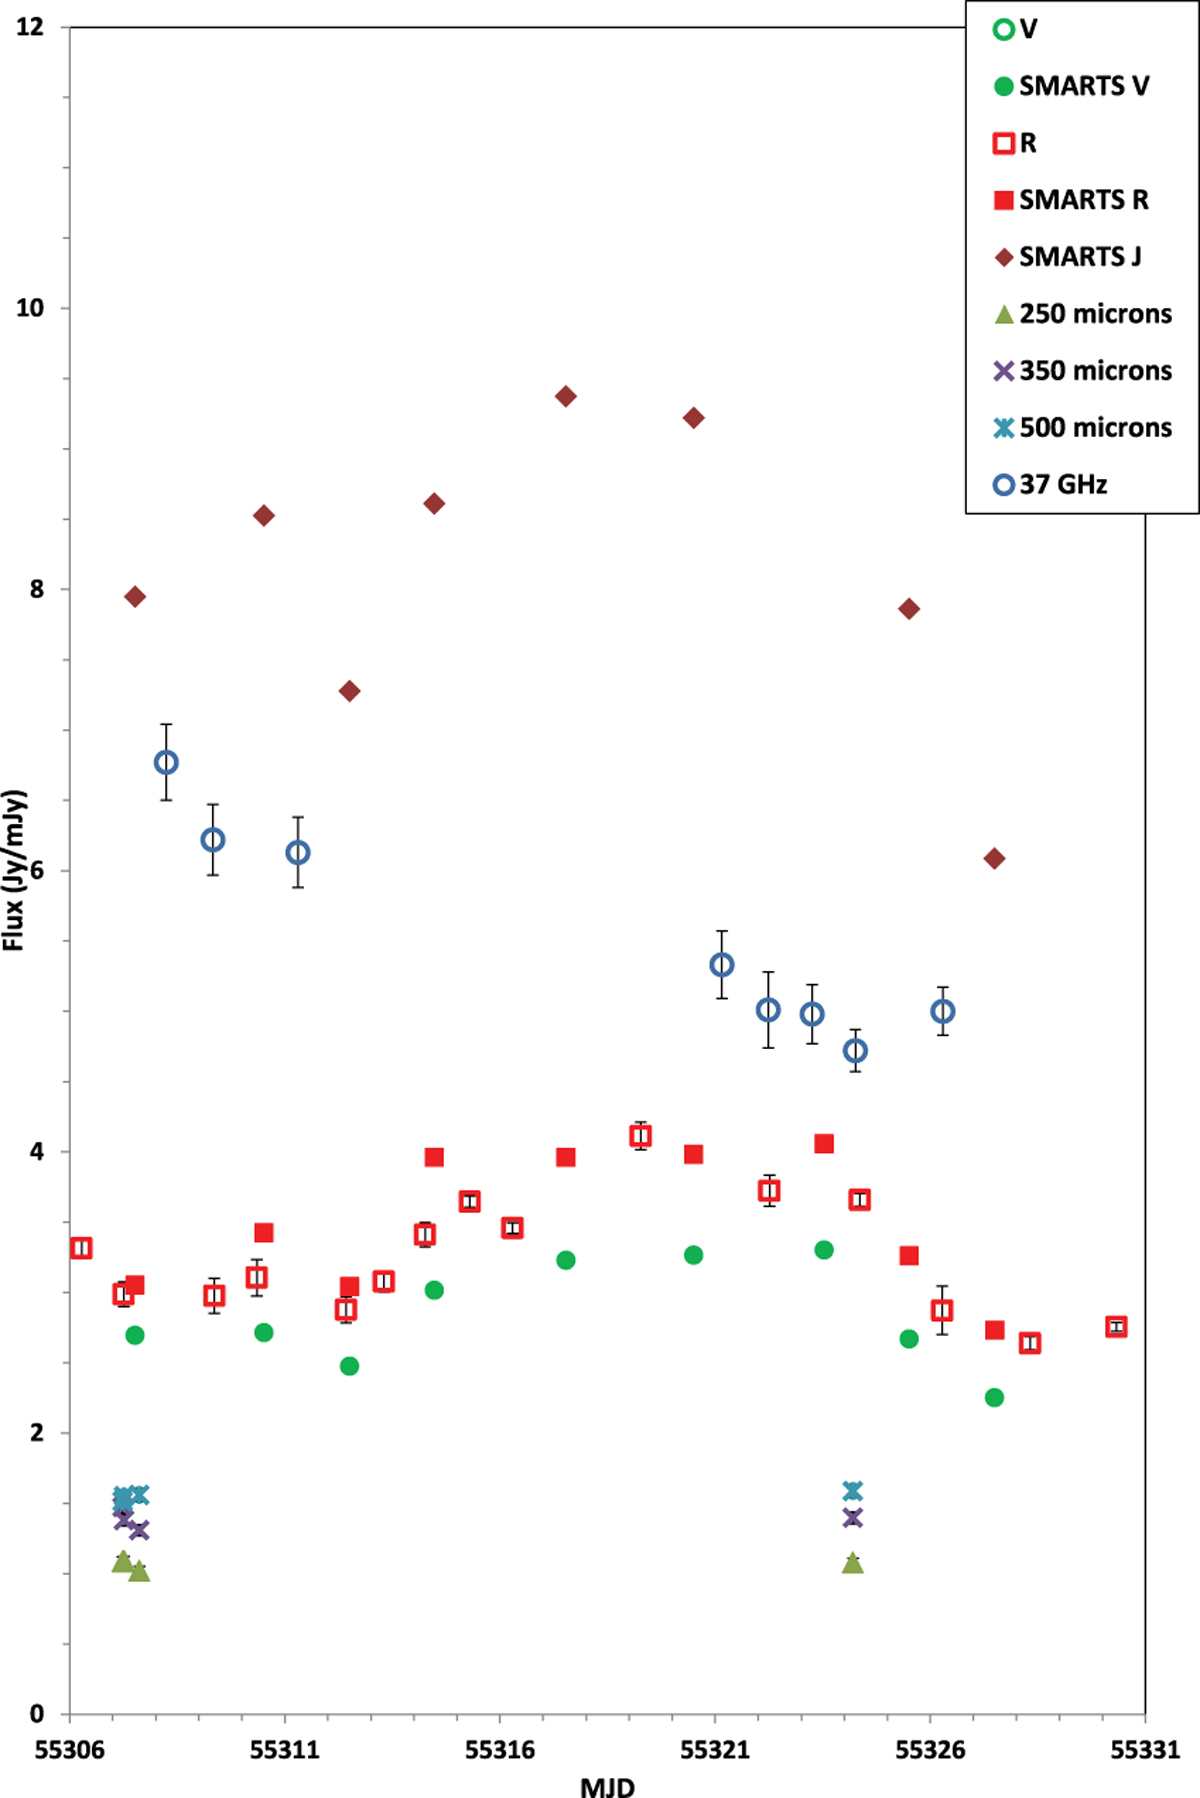
Flux curve of OJ 287 for the flare in late April and early May 2010 on an expanded scale. The flux in R increases by 40% in seven days. For clarity, the K data are neglected because they have more dispersion and do not show the flare clearly. Both the Herschel data and the 37 GHz data overlap the flare, with the Herschel data at the peak of the flare, but there is no clear evidence of an increase in flux in either frequency range at this time.
Current usage metrics show cumulative count of Article Views (full-text article views including HTML views, PDF and ePub downloads, according to the available data) and Abstracts Views on Vision4Press platform.
Data correspond to usage on the plateform after 2015. The current usage metrics is available 48-96 hours after online publication and is updated daily on week days.
Initial download of the metrics may take a while.