Fig. 3
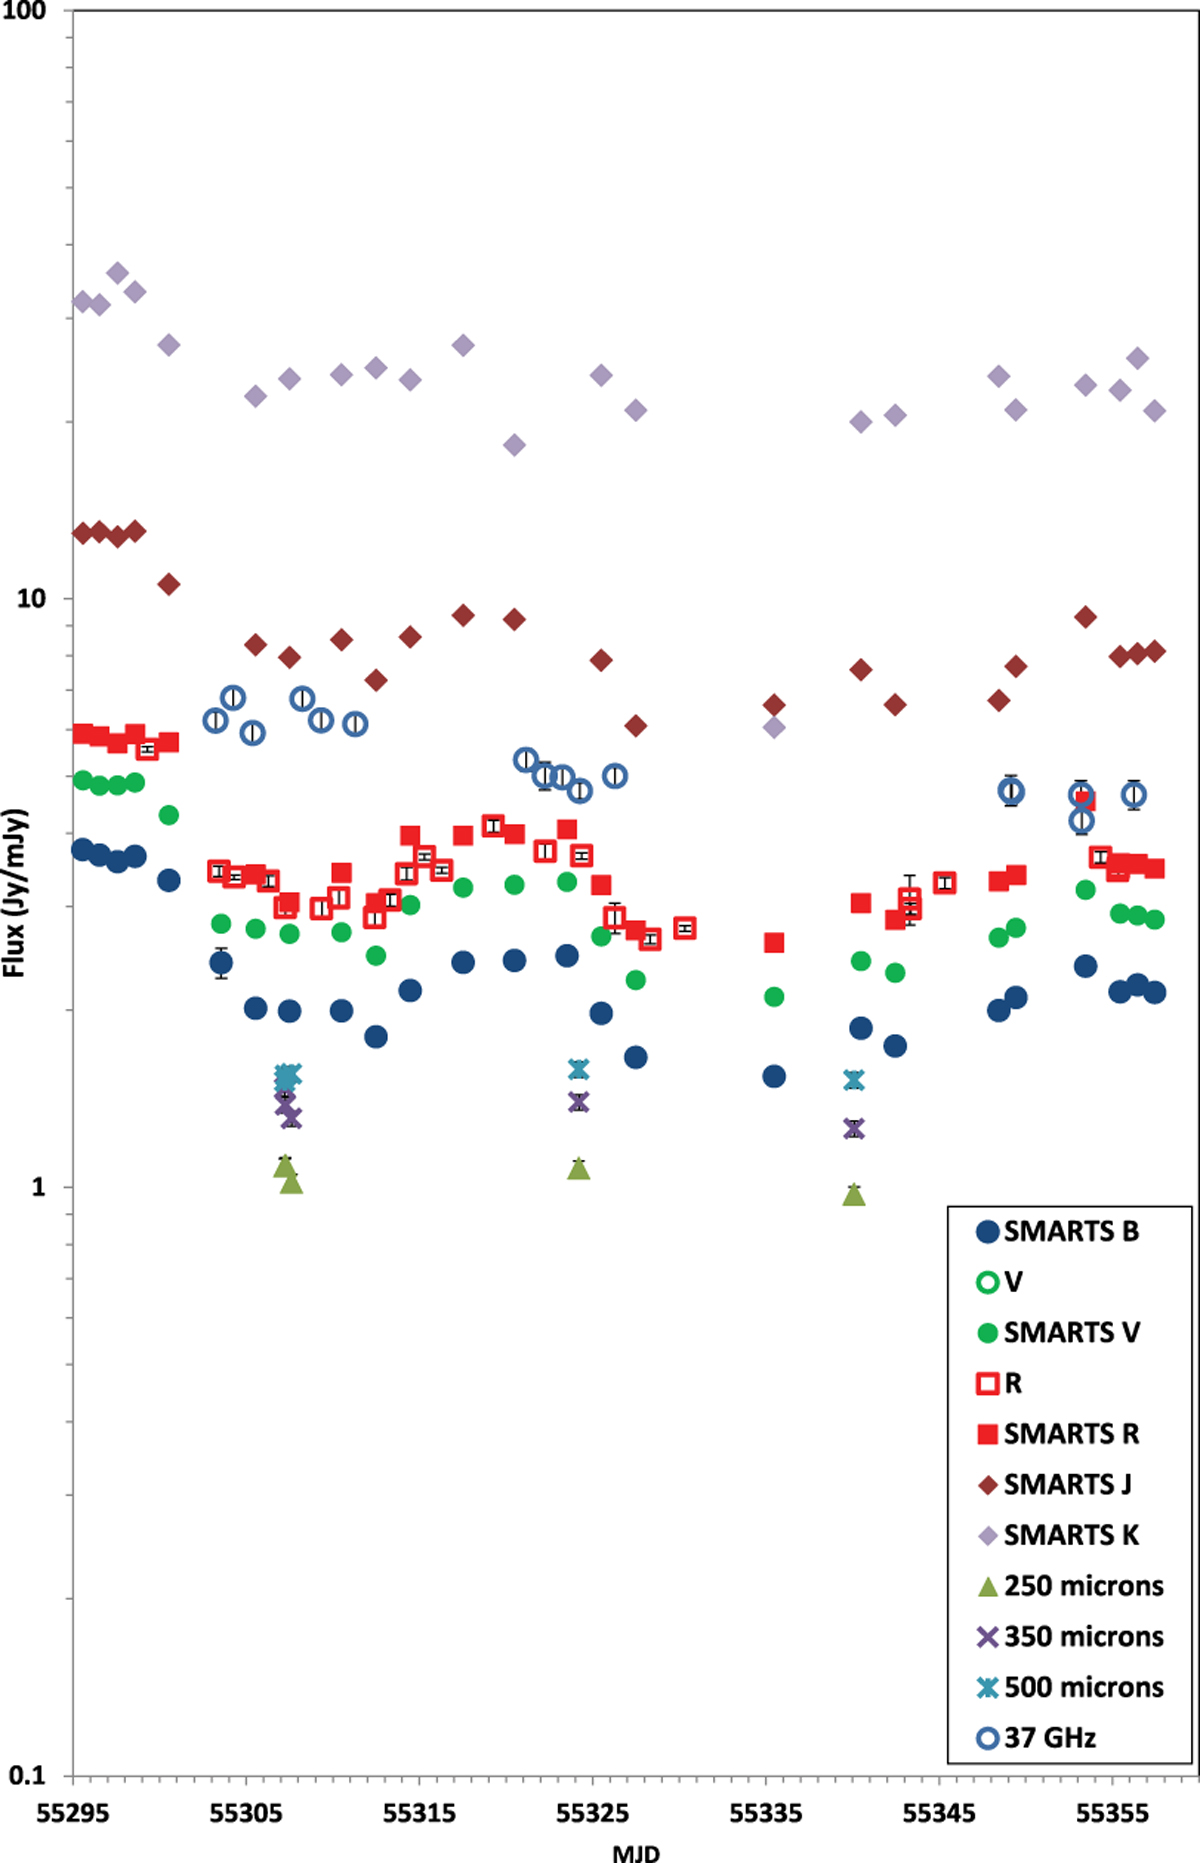
Flux curve of OJ 287 for April–May 2010. The Herschel-SPIRE data at 250, 350, and 500 μ m are shown alongside radio data from Metsähovi at 37 GHz (8 mm), the visible data in the R band from the Jagiellonian University archive, and SMARTS data in BV RJK. For clarity, the data in the visible and near-infrared are plotted in mJy so that they can be shown on the same scale as the radio and far-IR data (plotted in Jy). In many cases, the quoted error bars are smaller than the point size. No offset has been applied to bring the two main datasets in R onto the same scale, although there is evidence that on average, the SMARTS fluxes are ≈2% fainter than the Jagiellonian University/Mt. Suhora fluxes.
Current usage metrics show cumulative count of Article Views (full-text article views including HTML views, PDF and ePub downloads, according to the available data) and Abstracts Views on Vision4Press platform.
Data correspond to usage on the plateform after 2015. The current usage metrics is available 48-96 hours after online publication and is updated daily on week days.
Initial download of the metrics may take a while.