Fig. 11
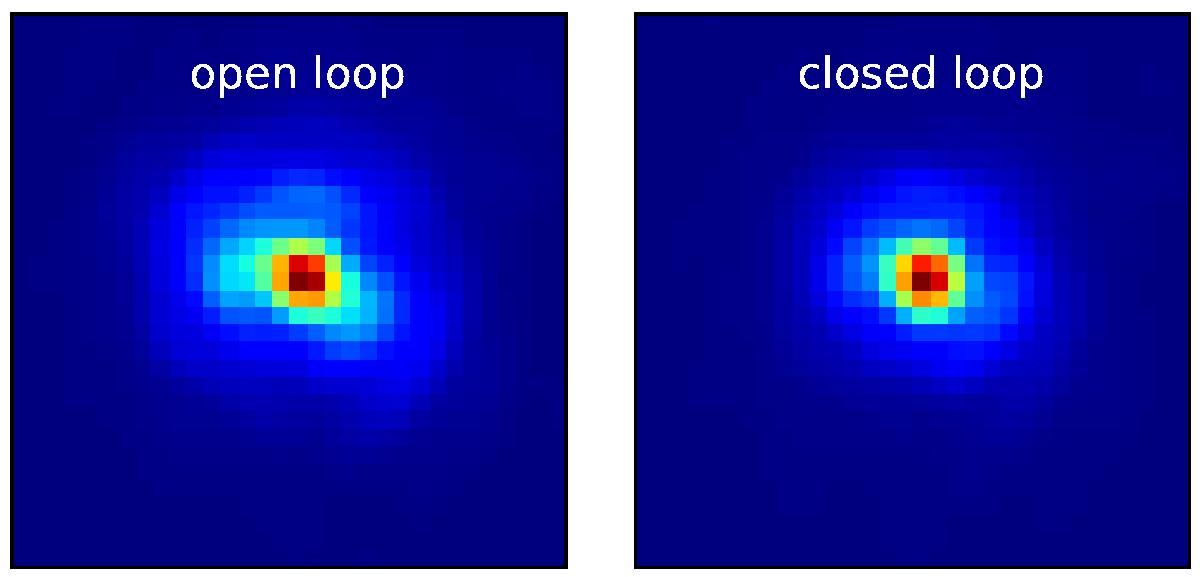
SCExAO/VAMPIRES images of Procyon A at 750 nm before (left) and after (right) our focal plane closed-loop wavefront control on the IE. A 0.5 power scale is used to represent these frames. Each image is normalized to its intensity peak and both frames are represented with a different color scale to enhance the image differences between them. The star image is sharper after IE compensation.
Current usage metrics show cumulative count of Article Views (full-text article views including HTML views, PDF and ePub downloads, according to the available data) and Abstracts Views on Vision4Press platform.
Data correspond to usage on the plateform after 2015. The current usage metrics is available 48-96 hours after online publication and is updated daily on week days.
Initial download of the metrics may take a while.