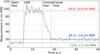
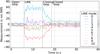
Fig. 10
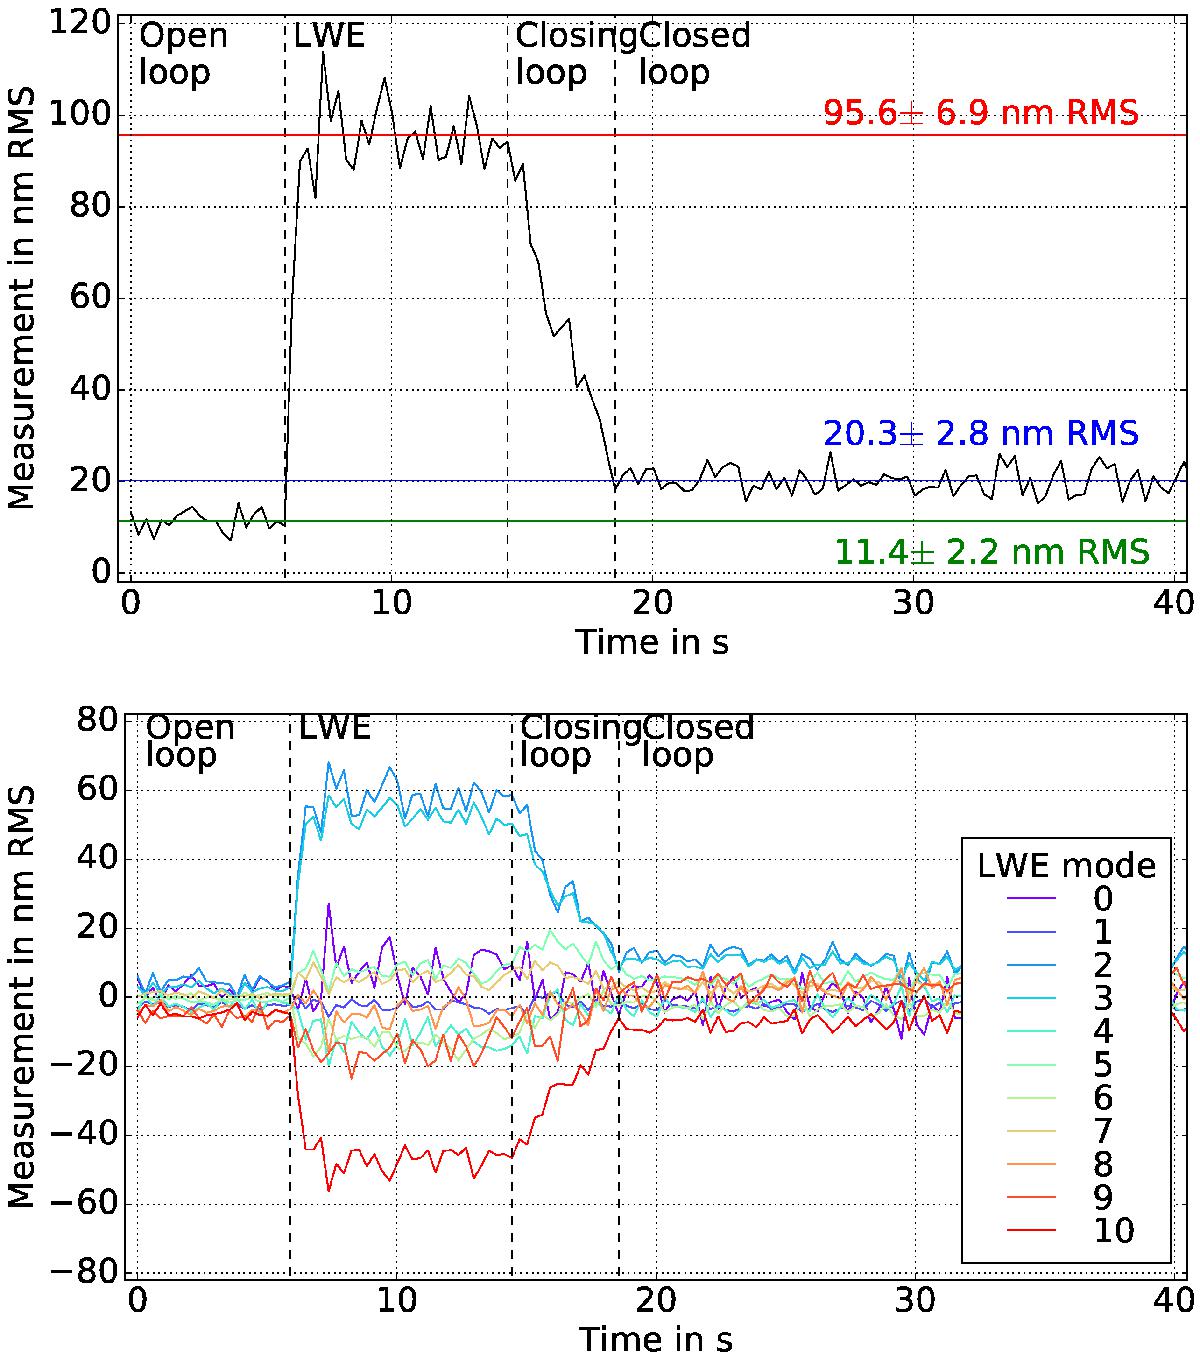
Temporal evolution of the wavefront error during the experiment to test the control loop with the IE. The successive steps are represented by the dashed vertical lines: open loop, introduction of IE map on the DM, closed-loop operation, and stability regime after closed-loop convergence. Top: total wavefront error. Bottom: wavefront error contribution for the coefficient corresponding to each IE mode.
Current usage metrics show cumulative count of Article Views (full-text article views including HTML views, PDF and ePub downloads, according to the available data) and Abstracts Views on Vision4Press platform.
Data correspond to usage on the plateform after 2015. The current usage metrics is available 48-96 hours after online publication and is updated daily on week days.
Initial download of the metrics may take a while.