Fig. 9
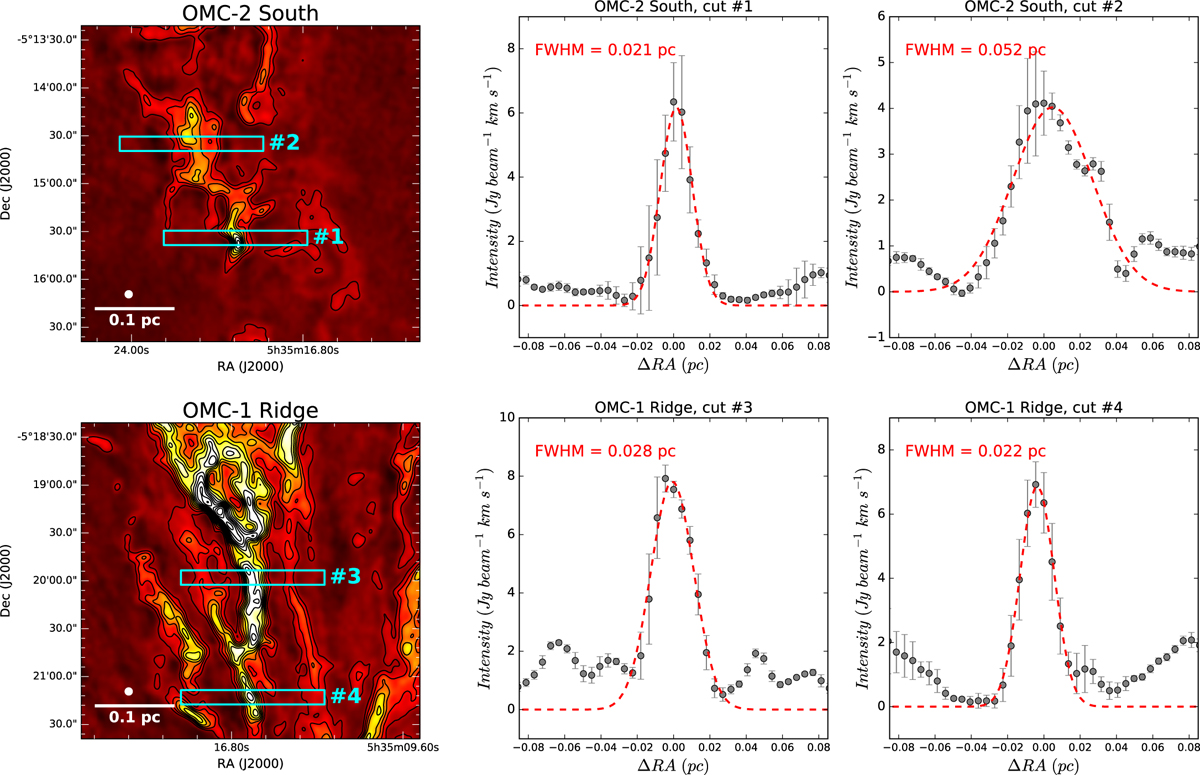
Typical fiber widths in both OMC-2 South (upper panel; fibers #30 and 34) and OMC-1 Ridge (lower panel; fibers #19 & #21) regions. Left subpanels: total integrated N2 H+ emission including the selected cuts (# 1–4) perpendicular to the fibers (cyan boxes). Contours are equally spaced every 1 Jy beam−1 km s−1. Center and right subpanels: average N2 H+ emission along cuts # 1–4 (gray dots with errors). The red dashed line indicates the Gaussian fits for each profile (see FWHM in the top-left corner of each subplot).
Current usage metrics show cumulative count of Article Views (full-text article views including HTML views, PDF and ePub downloads, according to the available data) and Abstracts Views on Vision4Press platform.
Data correspond to usage on the plateform after 2015. The current usage metrics is available 48-96 hours after online publication and is updated daily on week days.
Initial download of the metrics may take a while.