Fig. 7
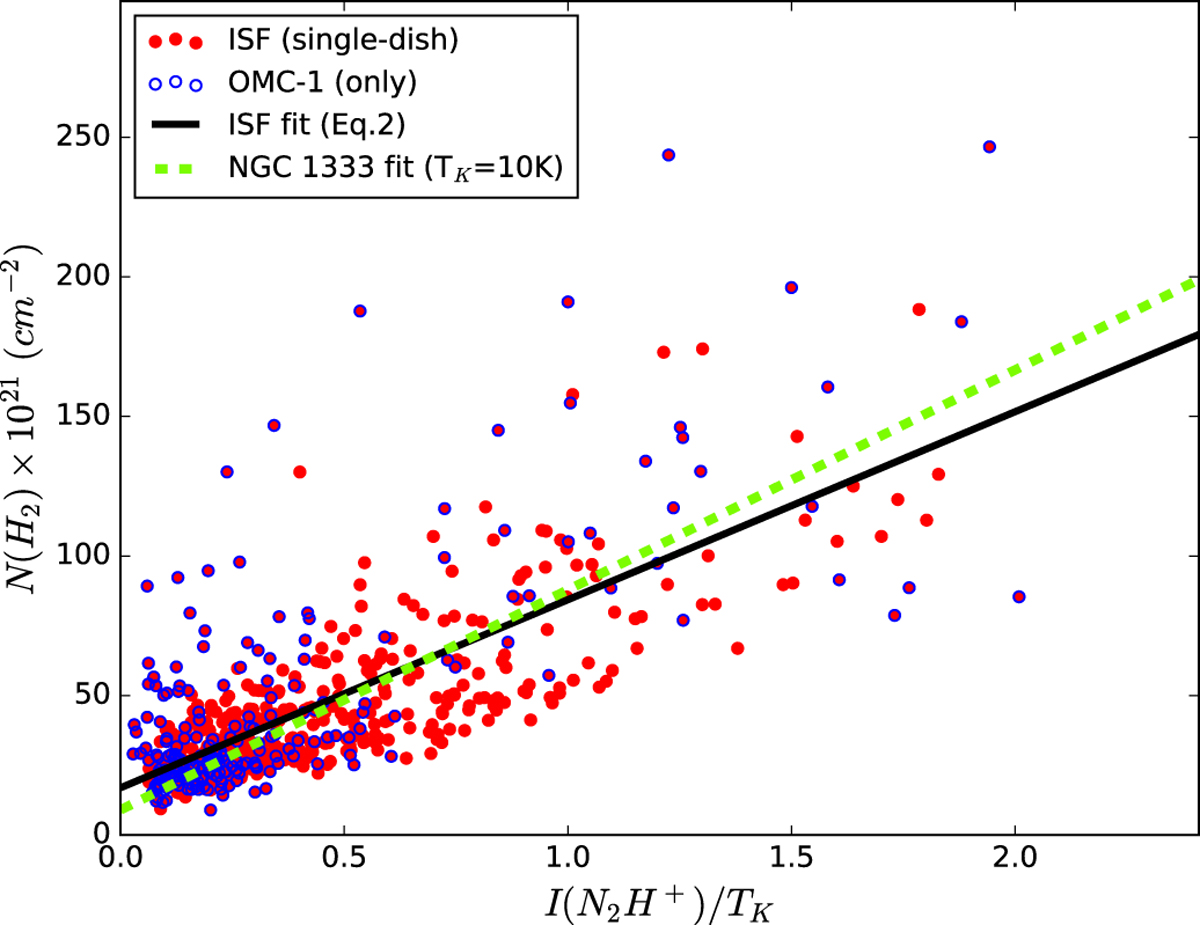
Empirical correlation between the observed single-dish N2 H+ intensities (Hacar et al. 2017a), normalized by the local gas kinetic temperature TK (Friesen et al. 2017), and the total (gas + dust) column densities N(H2 ) derived in previous Herschel-Planck measurements (Lombardi et al. 2014). This plot includes all the positions detected at R(Trapezium) ≥ 0.3 pc in both OMC-1 and OMC-2 clouds (red dots). Those points belonging to the OMC-1 region are highlighted in blue. The thick black line indicates the results of the linear fit defining Eq. (2). The green dashed line indicates the expected correlation for the observed N2 H+ intensities in the NGC1333 proto-cluster assuming a constant temperature of 10 K (Hacar et al. 2017b).
Current usage metrics show cumulative count of Article Views (full-text article views including HTML views, PDF and ePub downloads, according to the available data) and Abstracts Views on Vision4Press platform.
Data correspond to usage on the plateform after 2015. The current usage metrics is available 48-96 hours after online publication and is updated daily on week days.
Initial download of the metrics may take a while.