Fig. 3
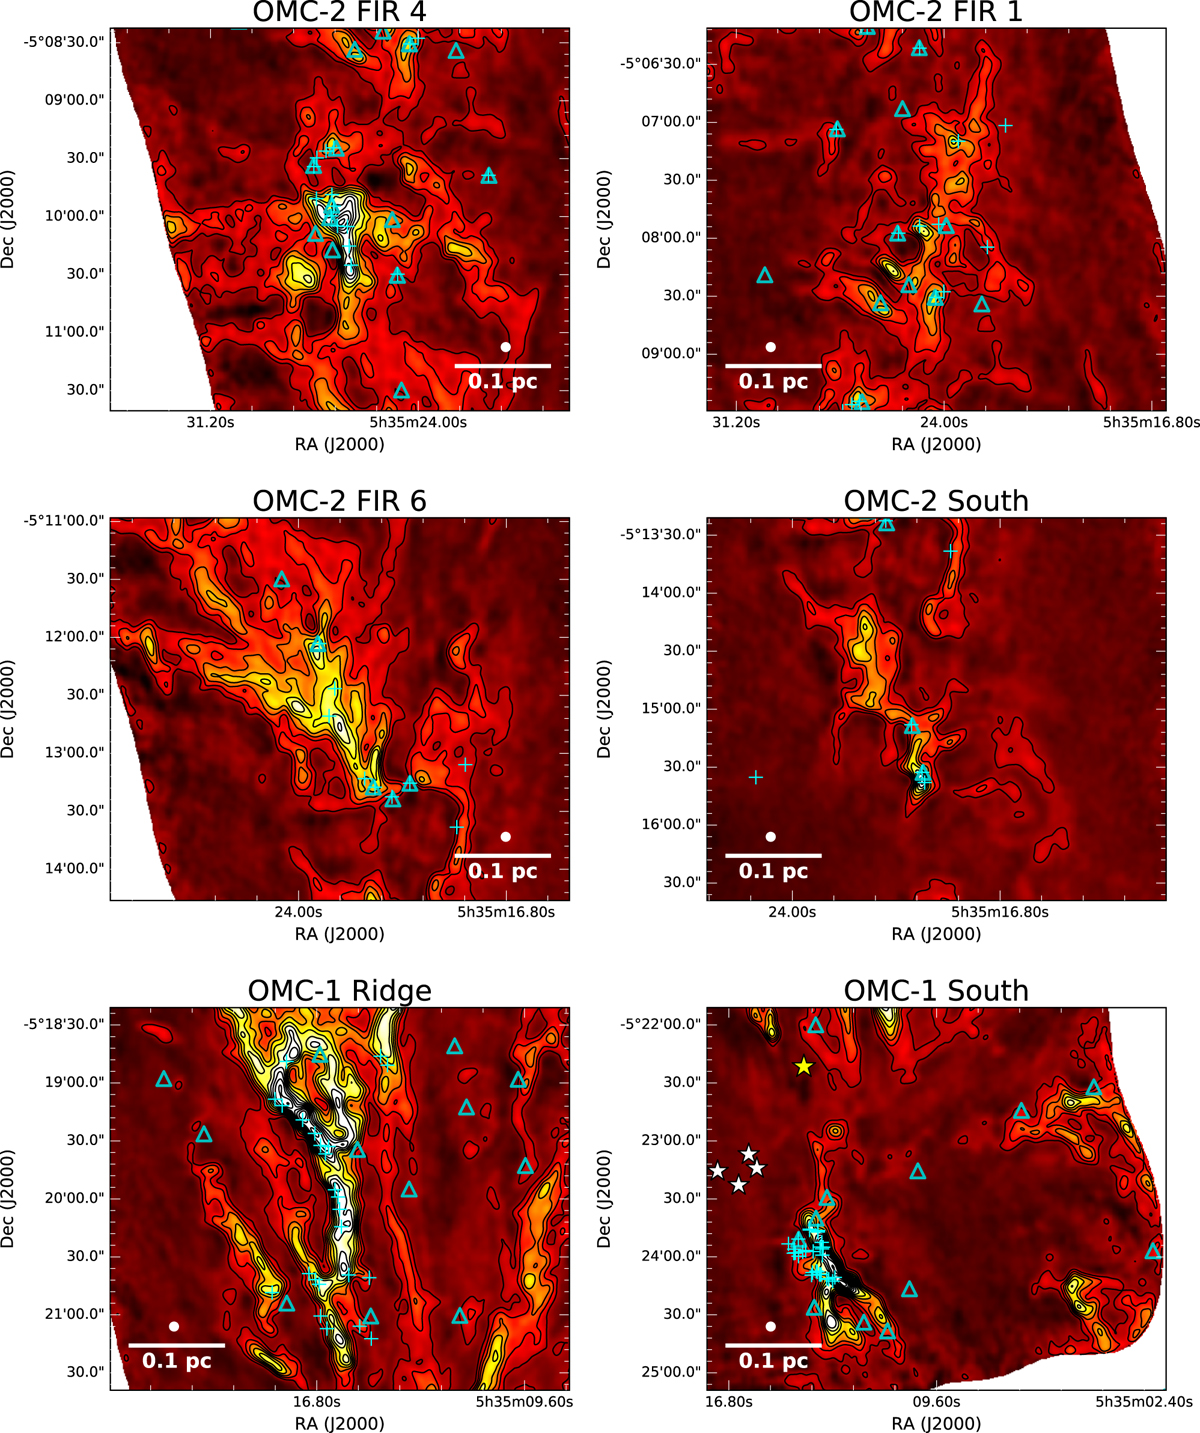
Close-up view of the total N2 H+ integrated emission in six selected regions along the ISF (see also Fig. 2). From left to right and from top to bottom: (a) OMC-2 FIR 4; (b) OMC-2 FIR 1; (c) OMC-2 FIR 6; (d) OMC-2 South; (e) OMC-1 Ridge; and (f) OMC-1 South. The positions of all the Spitzer protostars (blue triangles; Megeath et al. 2012; Stutz et al. 2013; Furlan et al. 2016) and continuum sources (blue crosses; Teixeira et al. 2016; Kainulainen et al. 2017; Palau et al. 2017) are indicated in all subpanels. Contours are equally spaced every 1 Jy beam−1 km s−1. The beamsize (white solid dot) and the characteristic 0.1 pc scale (white bar) are indicated in the lower corner of each subpanel.
Current usage metrics show cumulative count of Article Views (full-text article views including HTML views, PDF and ePub downloads, according to the available data) and Abstracts Views on Vision4Press platform.
Data correspond to usage on the plateform after 2015. The current usage metrics is available 48-96 hours after online publication and is updated daily on week days.
Initial download of the metrics may take a while.