Fig. A.1
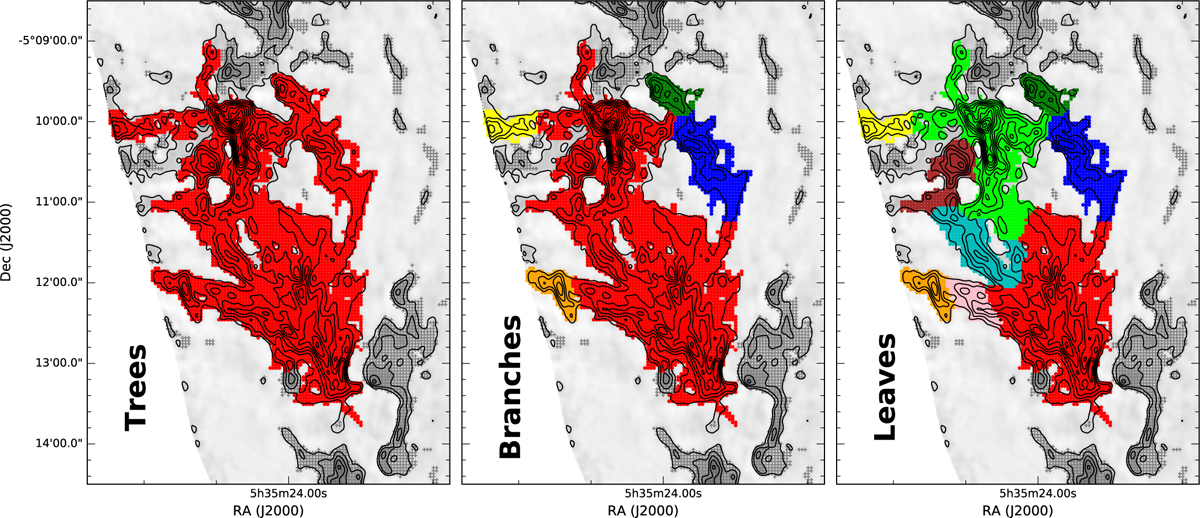
Structure identification in the OMC-2 region at different stages of the HiFIVE analysis. From left to right: (a) Trees, (b) Branches, and (c) Leaves (see text for a description). For simplicity, only those velocity structures extracted from the same initial tree are displayed in colors. The rest of the positions analyzed by HiFIVE are indicated by gray crosses. We notice that, although satisfactory in most cases, our HiFIVE analysis fails to describe some of the undoubtedly more complex gas substructure found in the ISF (e.g., fiber #37, see central leave shown in red).
Current usage metrics show cumulative count of Article Views (full-text article views including HTML views, PDF and ePub downloads, according to the available data) and Abstracts Views on Vision4Press platform.
Data correspond to usage on the plateform after 2015. The current usage metrics is available 48-96 hours after online publication and is updated daily on week days.
Initial download of the metrics may take a while.