Fig. 1
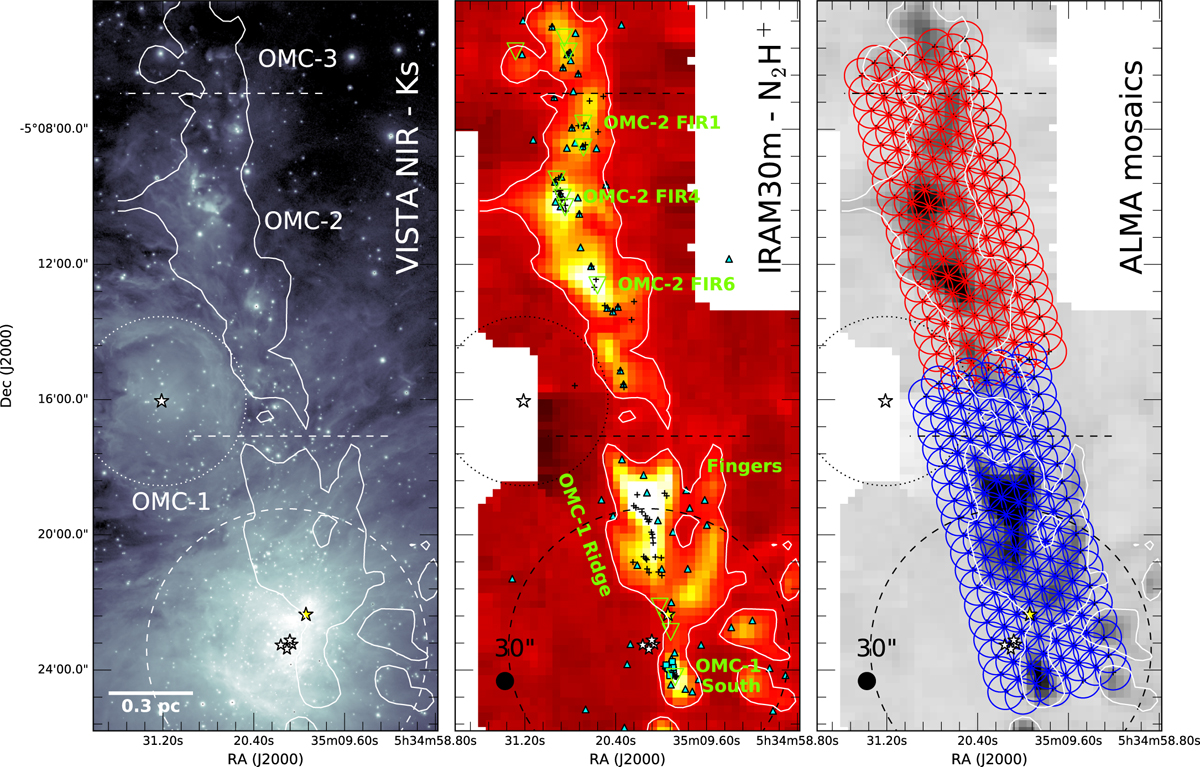
Description of our ALMA Cycle-3 observations along the ISF: left: VISTA NIR (Ks band) emission (Meingast et al. 2016); center: IRAM 30m (single-dish) N2 H+ (1-0) integrated emission (Hacar et al. 2017a); right: 12 m-array footprints of the two ALMA Cycle-3 mosaics (blue and red) presented in this work. The position of the Trapezium (white stars) and NU Ori stars (white isolated star), the Orion BN source (yellow star), and the innermost 0.5 pc radius of the ONC (dashed circle) are indicated in all panels. All figures include the contour enclosing those regions with integrated emission I(N2 H+) ≥ 20 mJy beam−1 according to the single-dish observations. The position of all the previously identified Spitzer protostars (blue triangles; Megeath et al. 2012; Stutz et al. 2013; Furlan et al. 2016), mm-continuum peaks (green triangles; Mezger et al. 1990; Chini et al. 1997), SMA (Teixeira et al. 2016) plus ALMA continuum sources (Kainulainen et al. 2017; Palau et al. 2017) (black crosses), and embedded X-ray objects (blue squares; Rivilla et al. 2013) are indicated in the central panel. The most relevent regions are also labelled in both VISTA and single-dish images. For reference, a scale bar denotes the angular size of a 0.3 pc region at the distance of the ONC (414 pc; Menten et al. 2007).
Current usage metrics show cumulative count of Article Views (full-text article views including HTML views, PDF and ePub downloads, according to the available data) and Abstracts Views on Vision4Press platform.
Data correspond to usage on the plateform after 2015. The current usage metrics is available 48-96 hours after online publication and is updated daily on week days.
Initial download of the metrics may take a while.