Free Access
Fig. 9
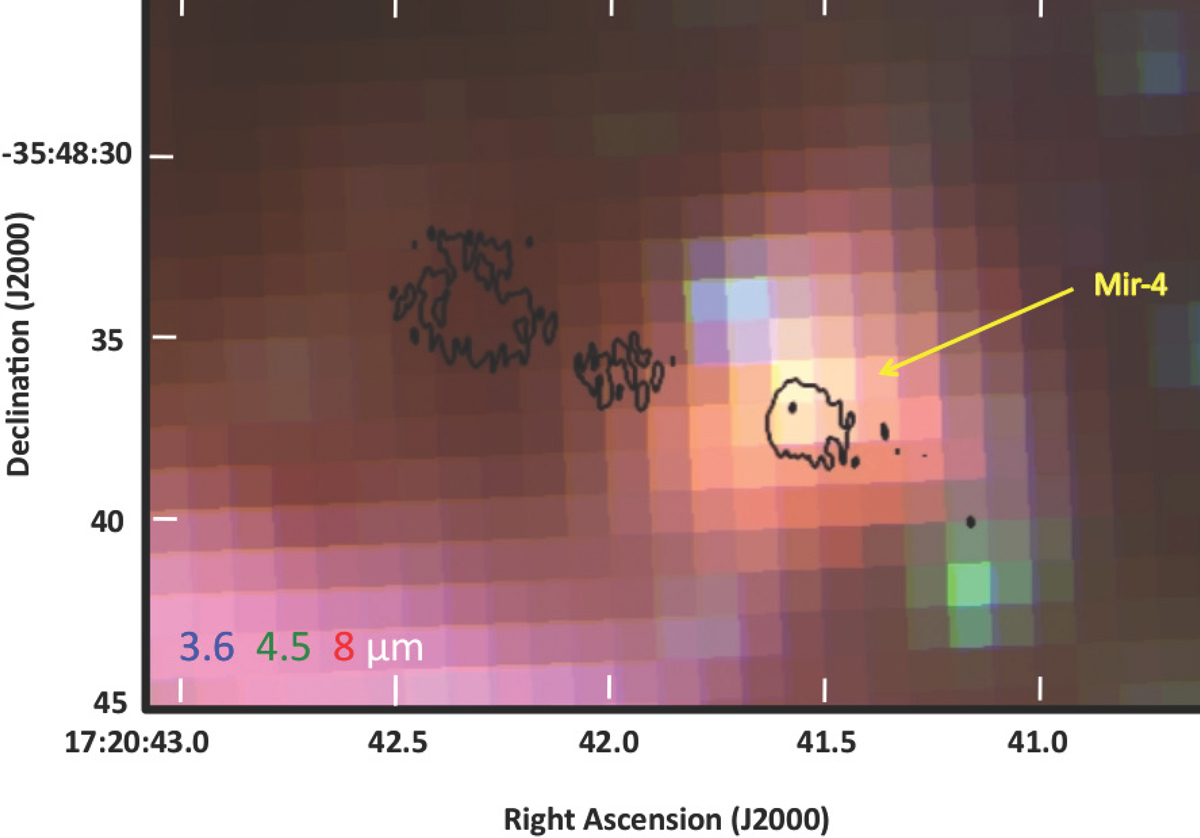
Composite infrared image around VLA J172041.59-354837.3 (CNS). Contours correspond to the radio image at 6.0 GHz, and contour levels are the same as Fig. 2. The yellow arrow indicate the positions of Mir-4 source.
Current usage metrics show cumulative count of Article Views (full-text article views including HTML views, PDF and ePub downloads, according to the available data) and Abstracts Views on Vision4Press platform.
Data correspond to usage on the plateform after 2015. The current usage metrics is available 48-96 hours after online publication and is updated daily on week days.
Initial download of the metrics may take a while.