Fig. 9
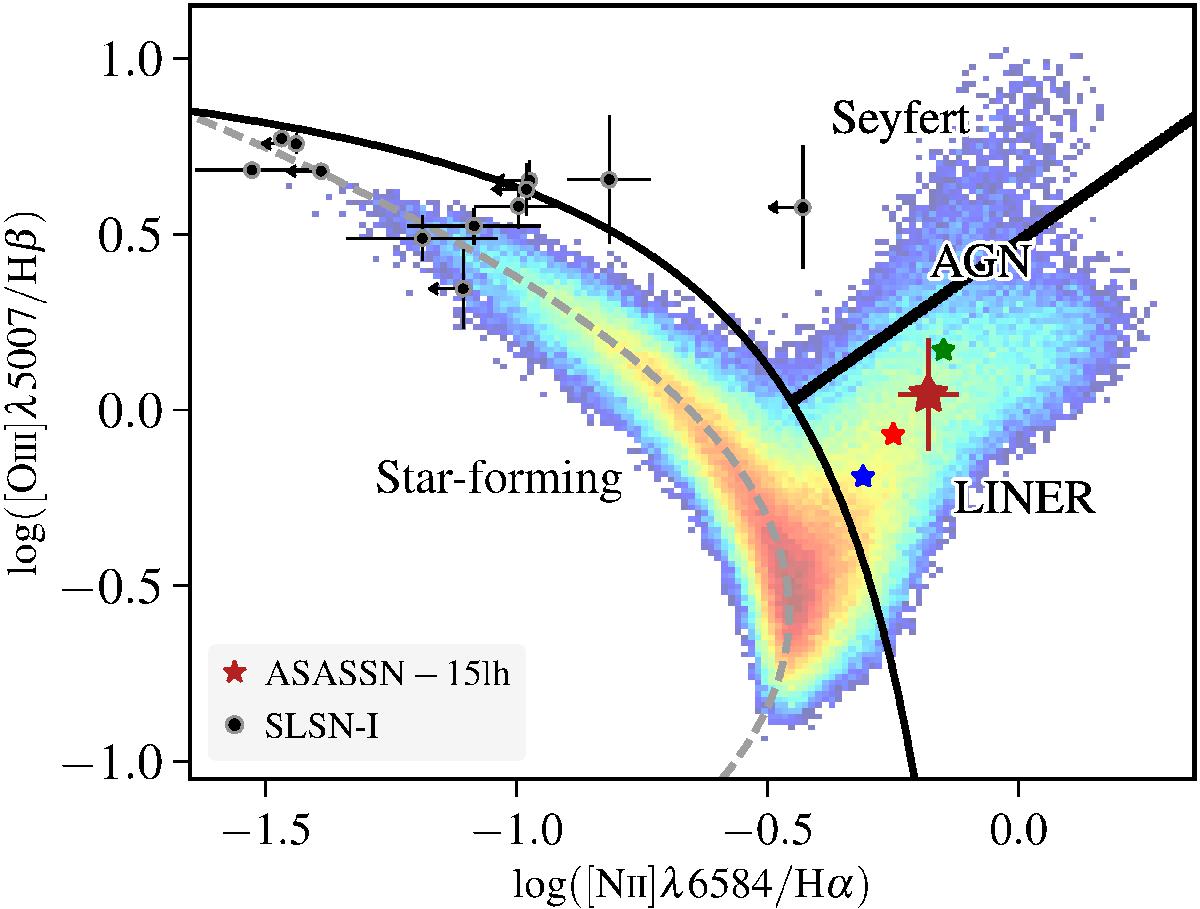
Host of ASASSN-15lh in the BPT diagram. The large red star represents the total integrated flux, while the three smaller stars show the three individual components in their respective color, i.e., the green is the central component. Error bars of the individual components are not shown to enhance clarity in the figure. To indicate the size of the respective error bars, the location of the smaller stars is consistent with each other within 1σ. The black data points indicate hydrogen-poor SLSNe from Leloudas et al. (2015) with limits indicated by arrows. The black solid lines represent differentiation lines between star-forming galaxies and AGN from Kewley et al. (2013) at z ~ 0.23, and between LINERs and Seyferts from Cid Fernandes et al. (2010). The gray dashed line indicates the ridge line, i.e., the line with the highest density of star-forming galaxies in SDSS (Brinchmann et al. 2008).
Current usage metrics show cumulative count of Article Views (full-text article views including HTML views, PDF and ePub downloads, according to the available data) and Abstracts Views on Vision4Press platform.
Data correspond to usage on the plateform after 2015. The current usage metrics is available 48-96 hours after online publication and is updated daily on week days.
Initial download of the metrics may take a while.