Fig. 8
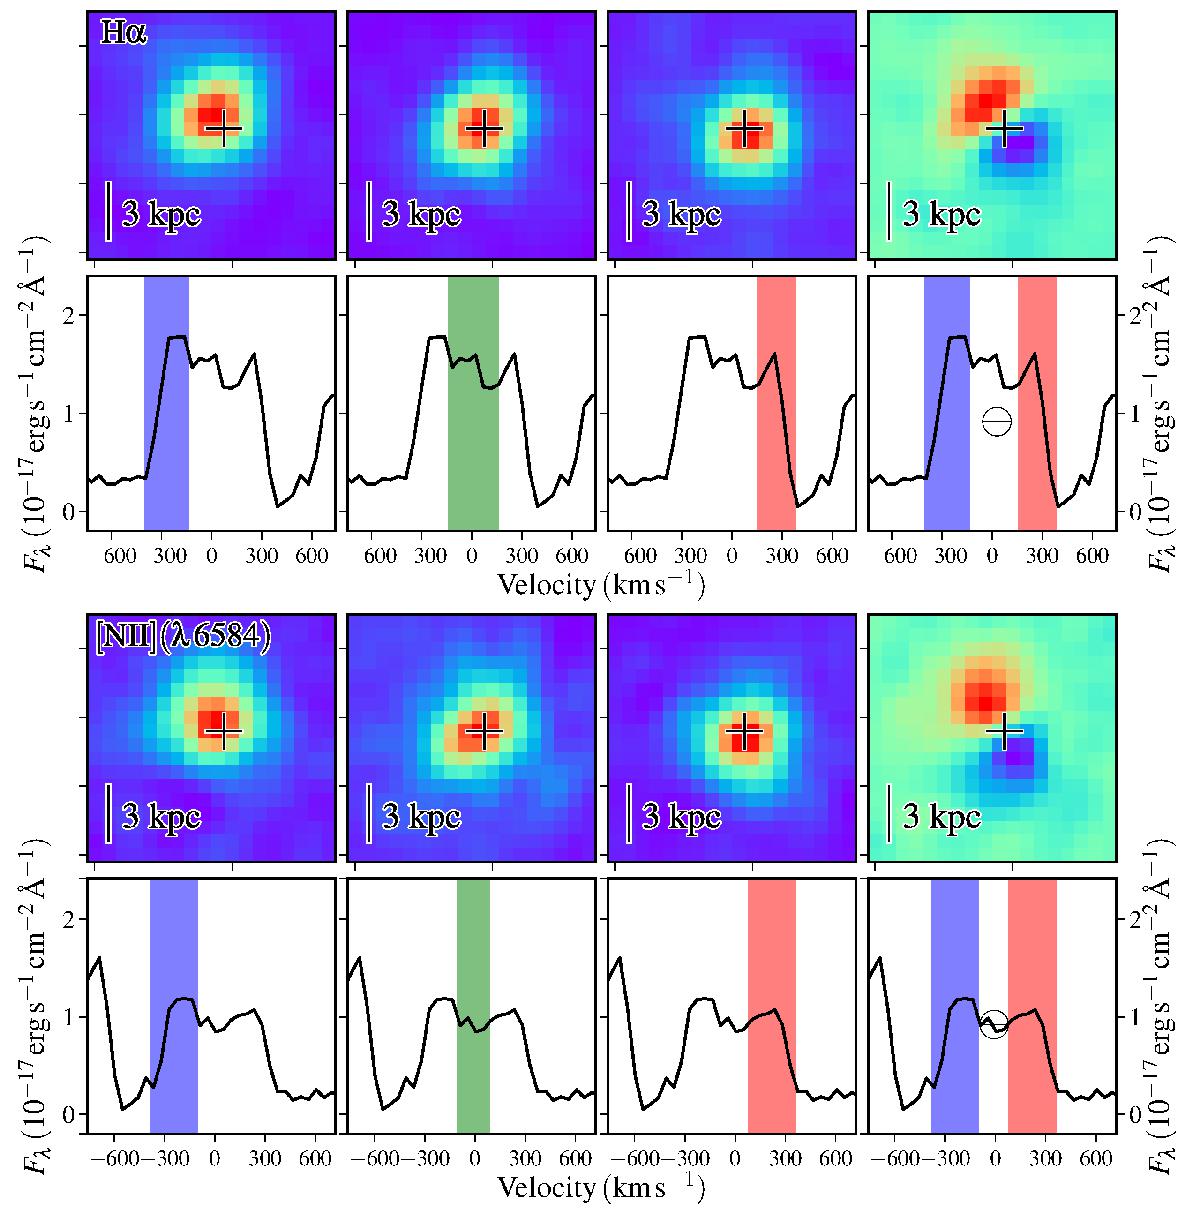
Channel maps of the velocity components. The two upper rows show in the three leftmost panels the reconstructed images in a given velocity range (indicated by the colored region in each spectrum) from the continuum-subtracted MUSE map for Hα. The right panel shows a subtraction between the blue and red components. The position of the transient is indicated by a cross. Two lower rows show the same for [N ii]. All images have been smoothed by a Gaussian kernel with a size of the FWHM of 2 px by 2 px for illustration purposes. The physical scale of the images is indicated by the bar in the lower left corner of each image. North is up and east is to the left in all images.
Current usage metrics show cumulative count of Article Views (full-text article views including HTML views, PDF and ePub downloads, according to the available data) and Abstracts Views on Vision4Press platform.
Data correspond to usage on the plateform after 2015. The current usage metrics is available 48-96 hours after online publication and is updated daily on week days.
Initial download of the metrics may take a while.