Fig. 7
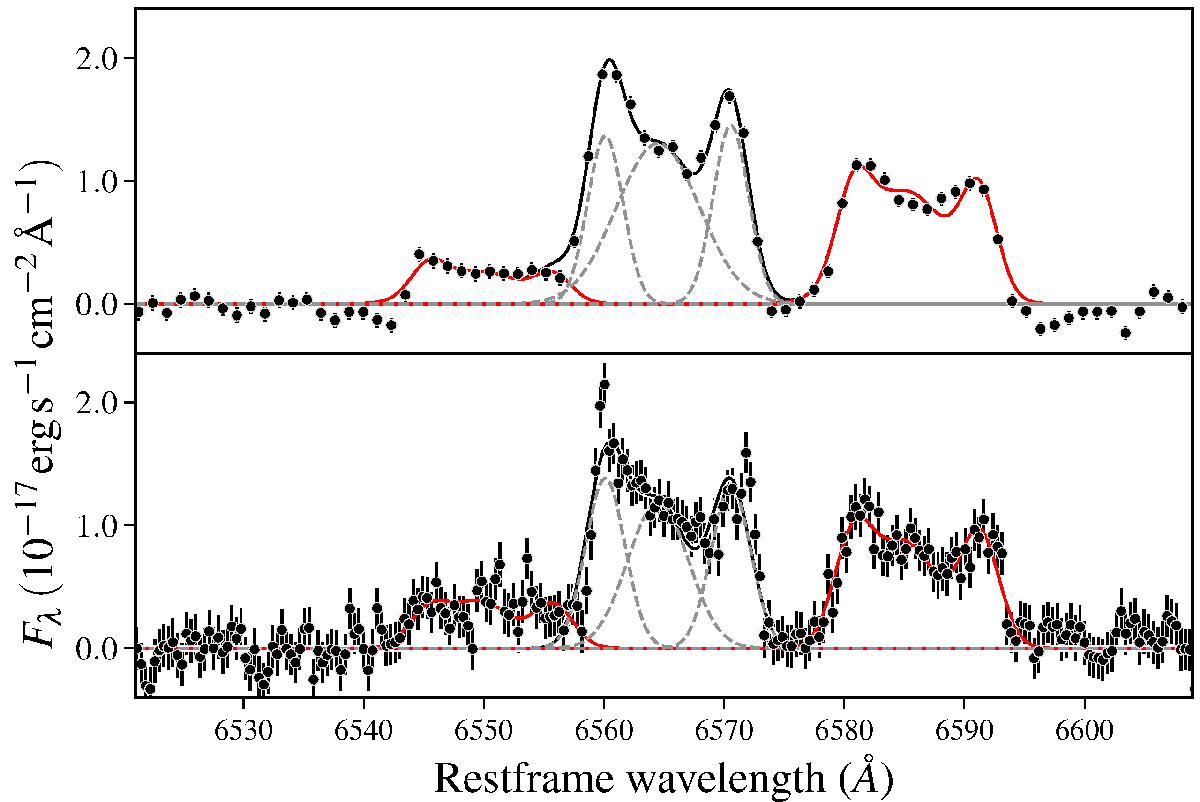
Emission-line profiles and component decomposition for the Hα and [N ii](λ6548, 6584) complex. Upper panel: spectrum extracted for the central component (radius of 0.̋9 or 3.4 kpc around the galaxy center) of the host galaxy from the MUSE data cube; lower panel: X-shooter spectrum. The contribution from [N ii] is shown in red; the total sum of the emission-line model in black. For Hα, we also plot the three individual Gaussian components with dashed lines.
Current usage metrics show cumulative count of Article Views (full-text article views including HTML views, PDF and ePub downloads, according to the available data) and Abstracts Views on Vision4Press platform.
Data correspond to usage on the plateform after 2015. The current usage metrics is available 48-96 hours after online publication and is updated daily on week days.
Initial download of the metrics may take a while.