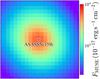
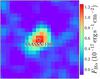
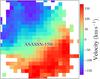
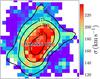
Fig. 5

Spatially resolved properties of the ASASSN-15lh host. In the top row, reconstructed images of total intensity in the MUSE spectral range (4650 Å to 9300 Å) in the left panel, and the central component of Hα emission in the right panel. The bottom row shows the stellar velocity field (left panel) and velocity dispersion σ(right panel). Each of these images is 6.′′2 by 6.′′2, which corresponds to 23 kpc by 23 kpc at the redshift of ASASSN-15lh. North is up and east is to the left.
Current usage metrics show cumulative count of Article Views (full-text article views including HTML views, PDF and ePub downloads, according to the available data) and Abstracts Views on Vision4Press platform.
Data correspond to usage on the plateform after 2015. The current usage metrics is available 48-96 hours after online publication and is updated daily on week days.
Initial download of the metrics may take a while.