Free Access
Fig. 6
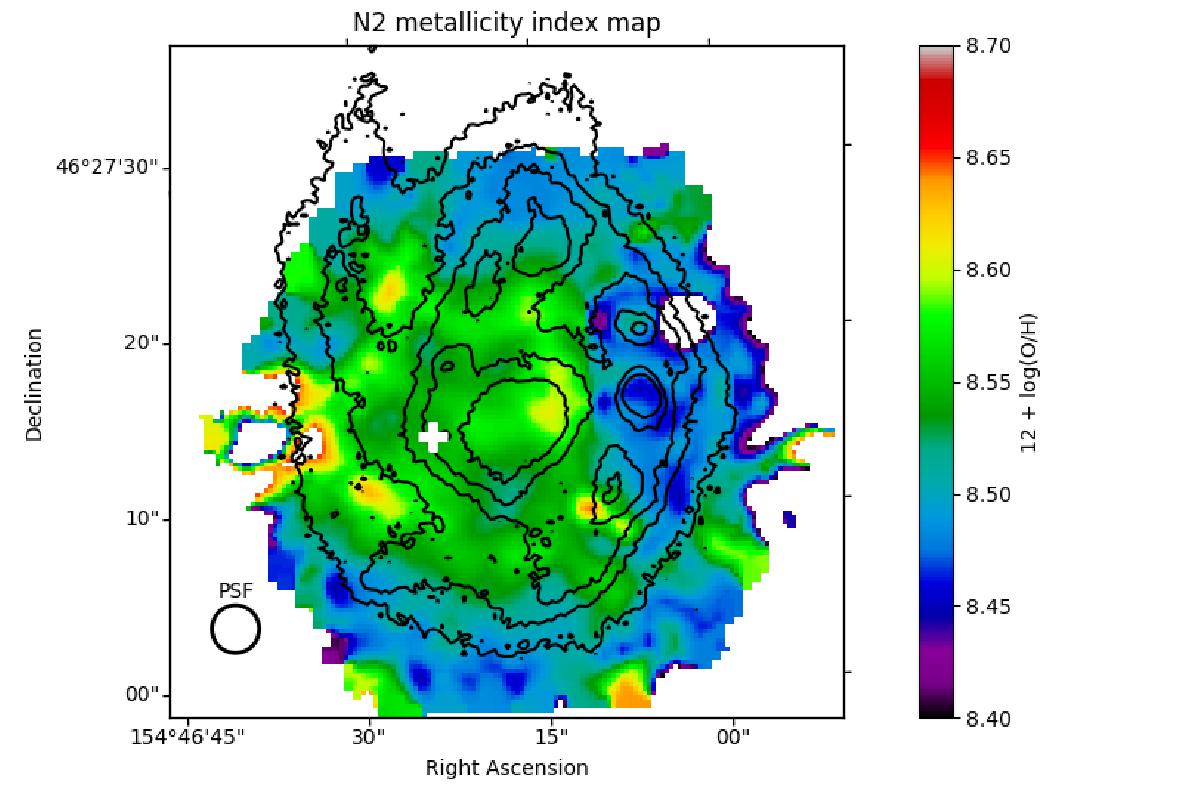
Metallicity map obtained from MaNGA data using the N2 indicator as given by Marino et al. (2013). The location of SLSN 2017egm is indicated by a black cross, while the location of PTF10bgl is indicated by a black circle.
Current usage metrics show cumulative count of Article Views (full-text article views including HTML views, PDF and ePub downloads, according to the available data) and Abstracts Views on Vision4Press platform.
Data correspond to usage on the plateform after 2015. The current usage metrics is available 48-96 hours after online publication and is updated daily on week days.
Initial download of the metrics may take a while.