Fig. 5
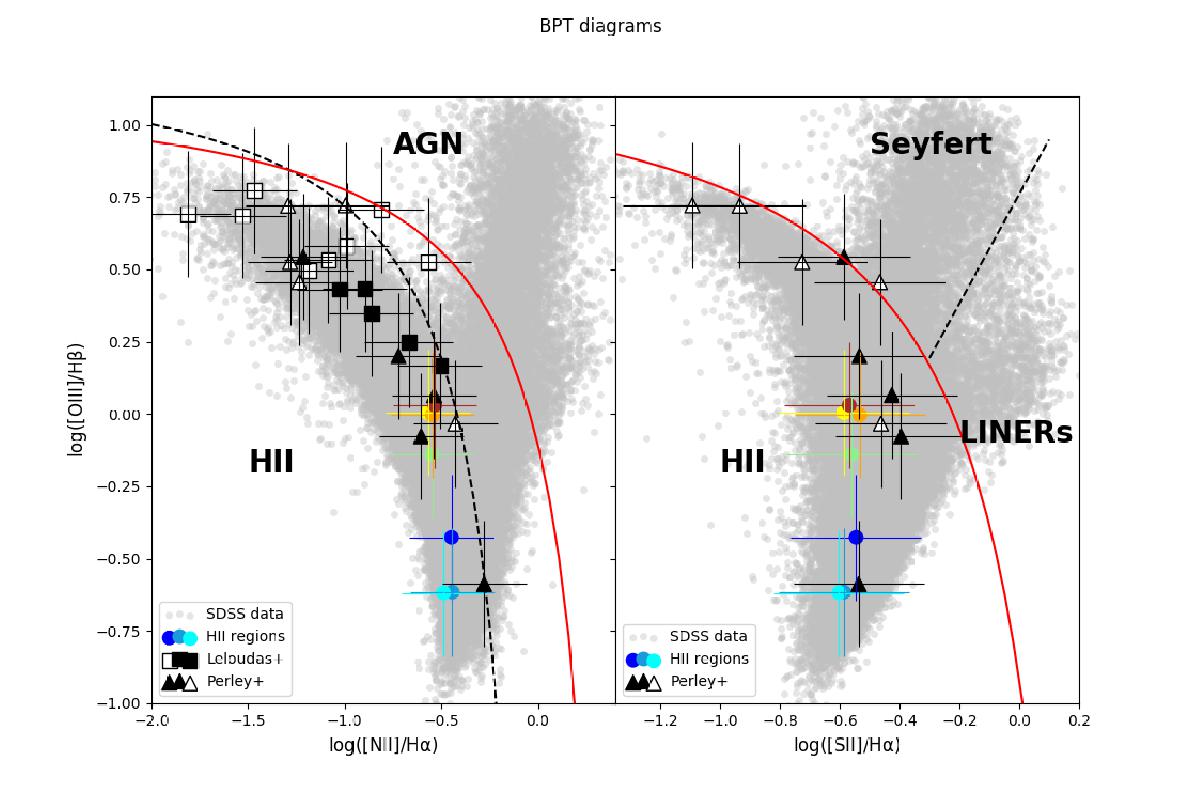
BPT emission-line diagnostic used to distinguish the ionisation mechanism acting in the nebular gas in galaxies. Two distinct diagnostics are used here: [O iii] 5008 Å/Hβ versus [N ii] 6584 Å/Hα (left) and the [S ii] 6718/32 Å doublet instead of [N ii] (right). The solid red curves in both panels denote the theoretical demarcation line between AGNs and star-forming galaxies proposed by Kewley et al. (2001). In the left panel, the black dashed curve corresponds to the empirical demarcation between AGNs and SF galaxies proposed by Kauffmann et al. (2003), while in the right panel the black dashed line marks the division between active Seyfert galaxies and LINERs proposed by (Kewley et al. 2006). Grey data points are taken from the SDSS DR7 sample of galaxies described in Tremonti et al. (2004). Coloured circles correspond to the H ii regions described in the text with the same colour-coding used in Fig. 1. Squares and triangles represent SLSN-host data from Leloudas et al. (2015) and Perley et al. (2016); empty symbols represent H-poor SLSNe, filled symbols H-rich SLSNe. The SLSN 2017egm location (light green circle) shows it is one of the most metal-rich Type I SLSN.
Current usage metrics show cumulative count of Article Views (full-text article views including HTML views, PDF and ePub downloads, according to the available data) and Abstracts Views on Vision4Press platform.
Data correspond to usage on the plateform after 2015. The current usage metrics is available 48-96 hours after online publication and is updated daily on week days.
Initial download of the metrics may take a while.