Fig. 4
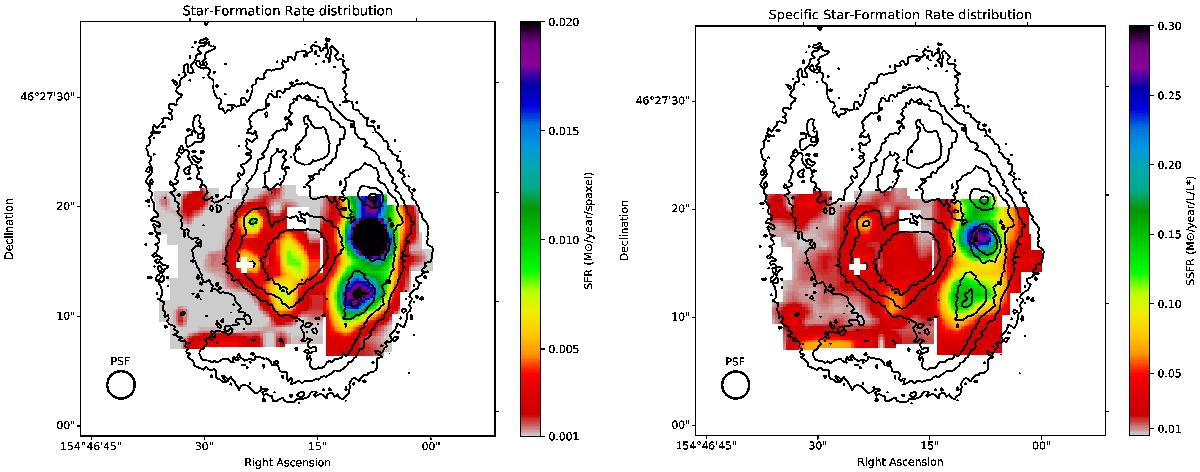
Left panel: SFR map in the galaxy for the two fields covered by PMAS observations, computed using the Kennicutt (1989) diagnostic. Right panel: specific SFR obtained by weighting the SFR map and the rest-frame B-luminosity map, applying the same method described in Christensen et al. (2004). The dimensions of each spaxel have been interpolated in the figure, showing elements of 0.25 × 0.25 arcsec. The SLSN position is marked with a white cross.
Current usage metrics show cumulative count of Article Views (full-text article views including HTML views, PDF and ePub downloads, according to the available data) and Abstracts Views on Vision4Press platform.
Data correspond to usage on the plateform after 2015. The current usage metrics is available 48-96 hours after online publication and is updated daily on week days.
Initial download of the metrics may take a while.