Fig. 10
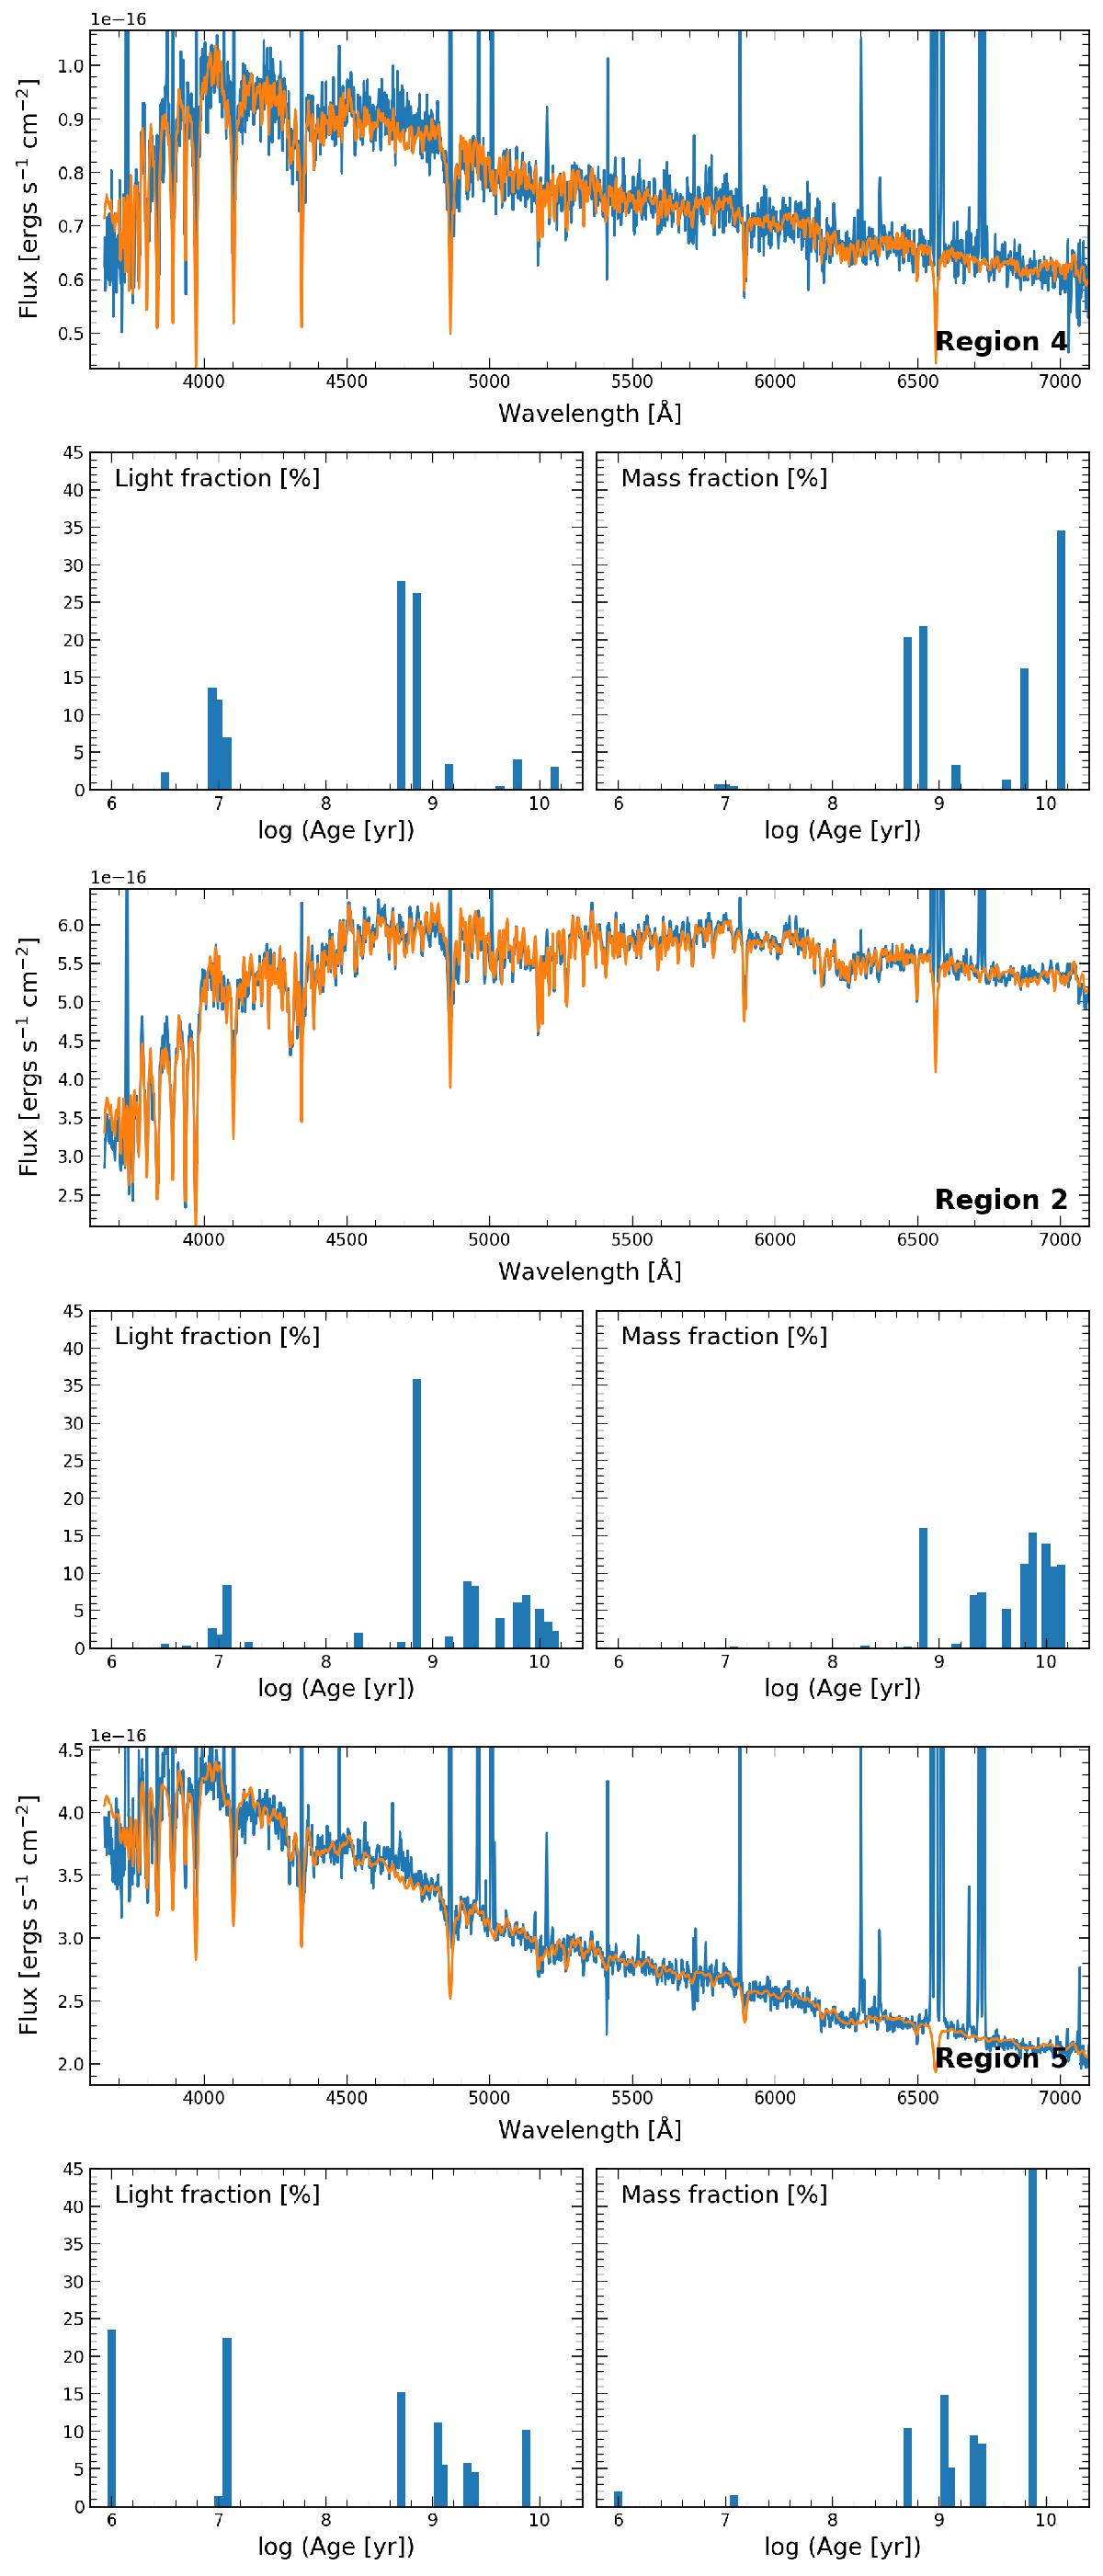
From top to bottom, the stellar population analysis of H ii regions 4 (the SLSN region), 2 (the galaxy centre), and 5 (the most active region in the galaxy). The upper panels show the fit to the observed spectral energy distributions, while the lower panels show the fraction in luminosity of stellar populations with different ages (left) and their contribution to the total stellar mass (right).
Current usage metrics show cumulative count of Article Views (full-text article views including HTML views, PDF and ePub downloads, according to the available data) and Abstracts Views on Vision4Press platform.
Data correspond to usage on the plateform after 2015. The current usage metrics is available 48-96 hours after online publication and is updated daily on week days.
Initial download of the metrics may take a while.