Fig. 8
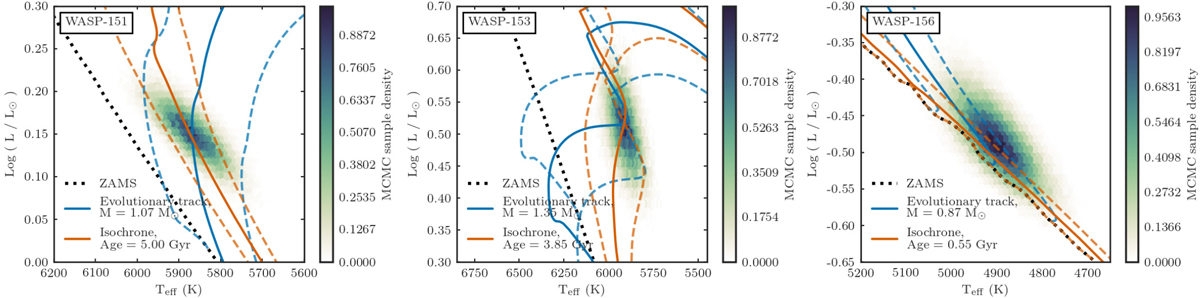
WASP-151, WASP-153 and WASP-156 marginalized posterior distribution in the Hertzsprung–Russell diagram. The dotted black lines correspond to the zero-age main sequence (ZAMS) at best-fit [Fe∕H]. This is defined as the time at which the star reaches its minimum luminosity and stellar ages are measured relative to this time. The blue lines are stellar mass evolutionary tracks and the orange ones are age isochrones.For both isochrones and evolutionary tracks the solid line correspond to the best-fit model (maximum of joint likelihood distribution) and the dashed lines correspond to the two extrema of the 68% confidence interval. For more details see Sect. 3.2.2 and Table A.6.
Current usage metrics show cumulative count of Article Views (full-text article views including HTML views, PDF and ePub downloads, according to the available data) and Abstracts Views on Vision4Press platform.
Data correspond to usage on the plateform after 2015. The current usage metrics is available 48-96 hours after online publication and is updated daily on week days.
Initial download of the metrics may take a while.