Fig. 6
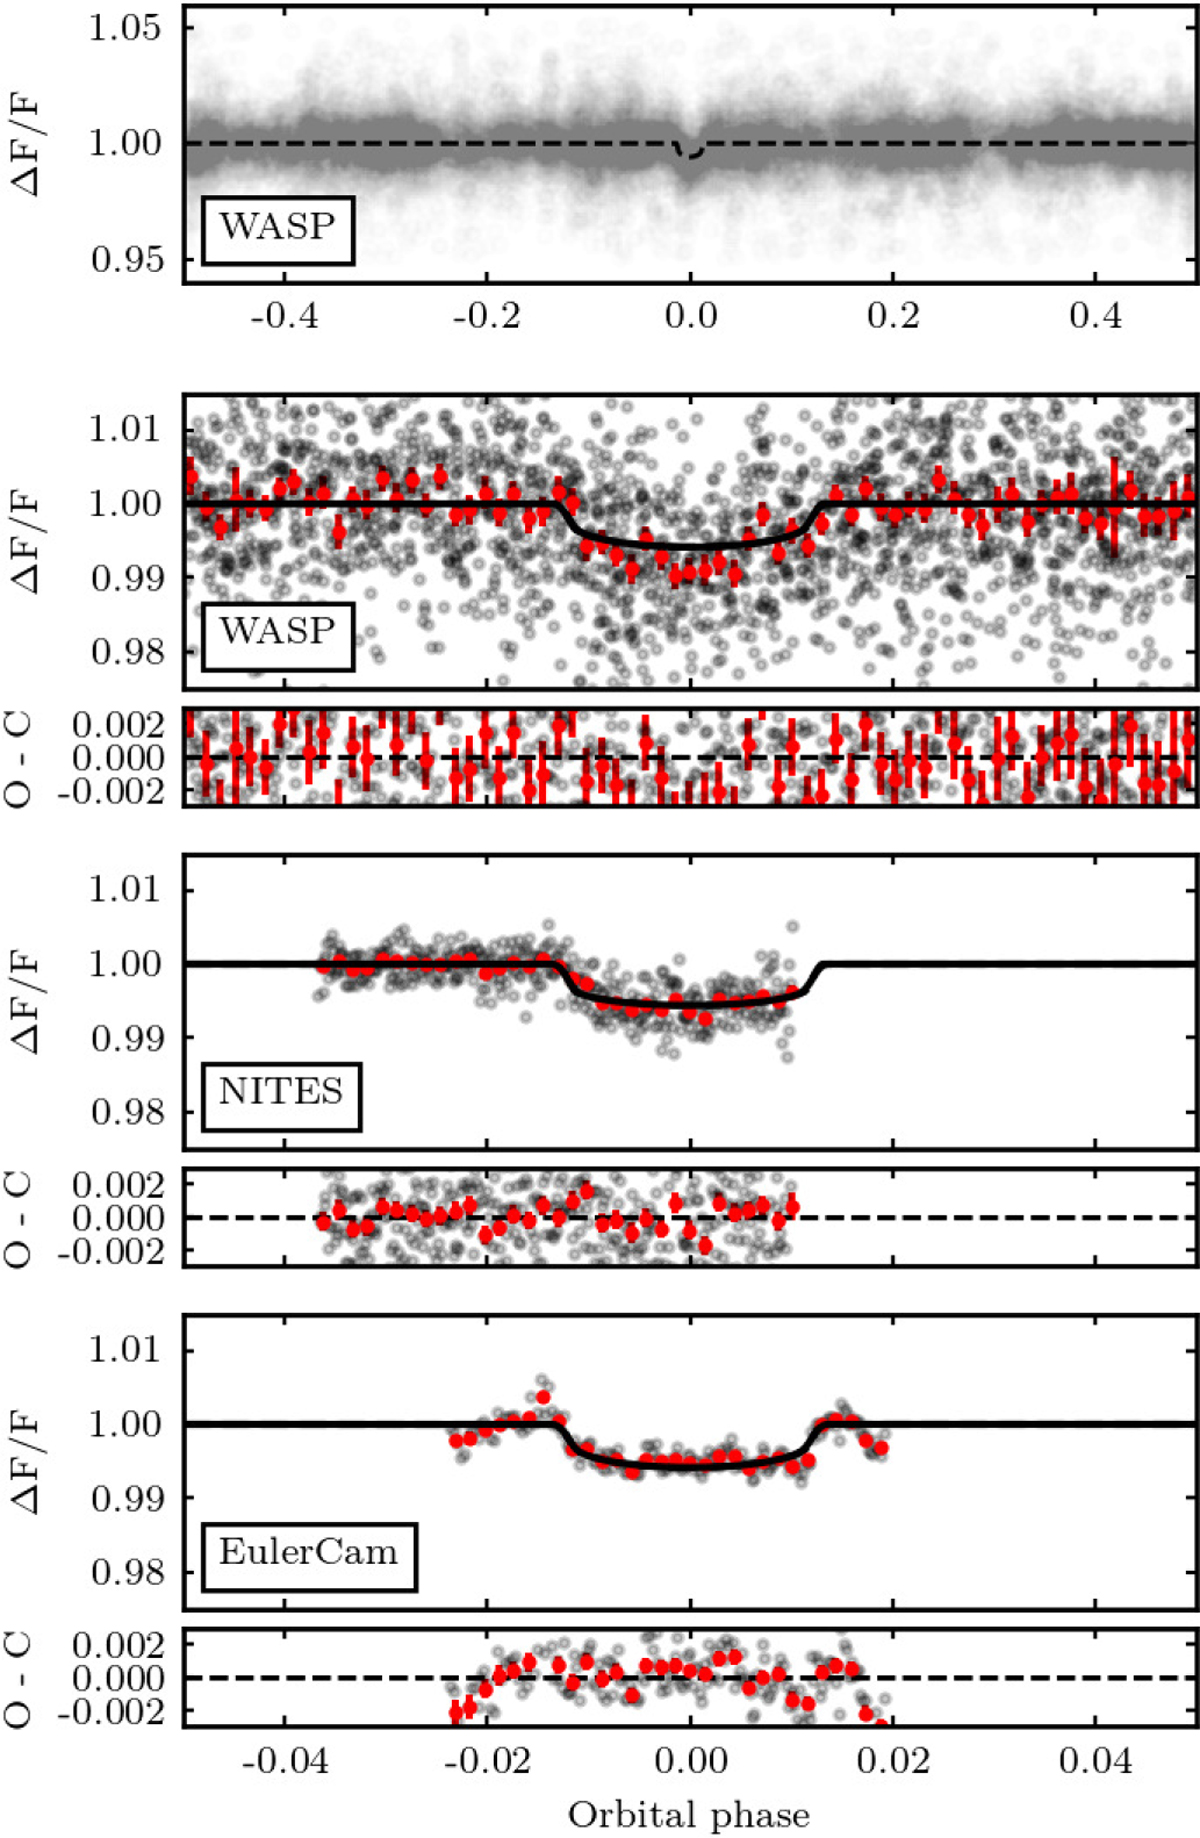
Photometry of WASP-156. The black or gray points are the data points at the original cadence of the observations, displayed without error bars for clarity. The red points corresponds to the same data points binned in phase with a bin width equivalent to eight minutes. These points are represented with their associated 1σ error bars. The black dashed and solid lines correspond to the best-fit model at the original and binned cadence respectively.
Current usage metrics show cumulative count of Article Views (full-text article views including HTML views, PDF and ePub downloads, according to the available data) and Abstracts Views on Vision4Press platform.
Data correspond to usage on the plateform after 2015. The current usage metrics is available 48-96 hours after online publication and is updated daily on week days.
Initial download of the metrics may take a while.