Fig. 2
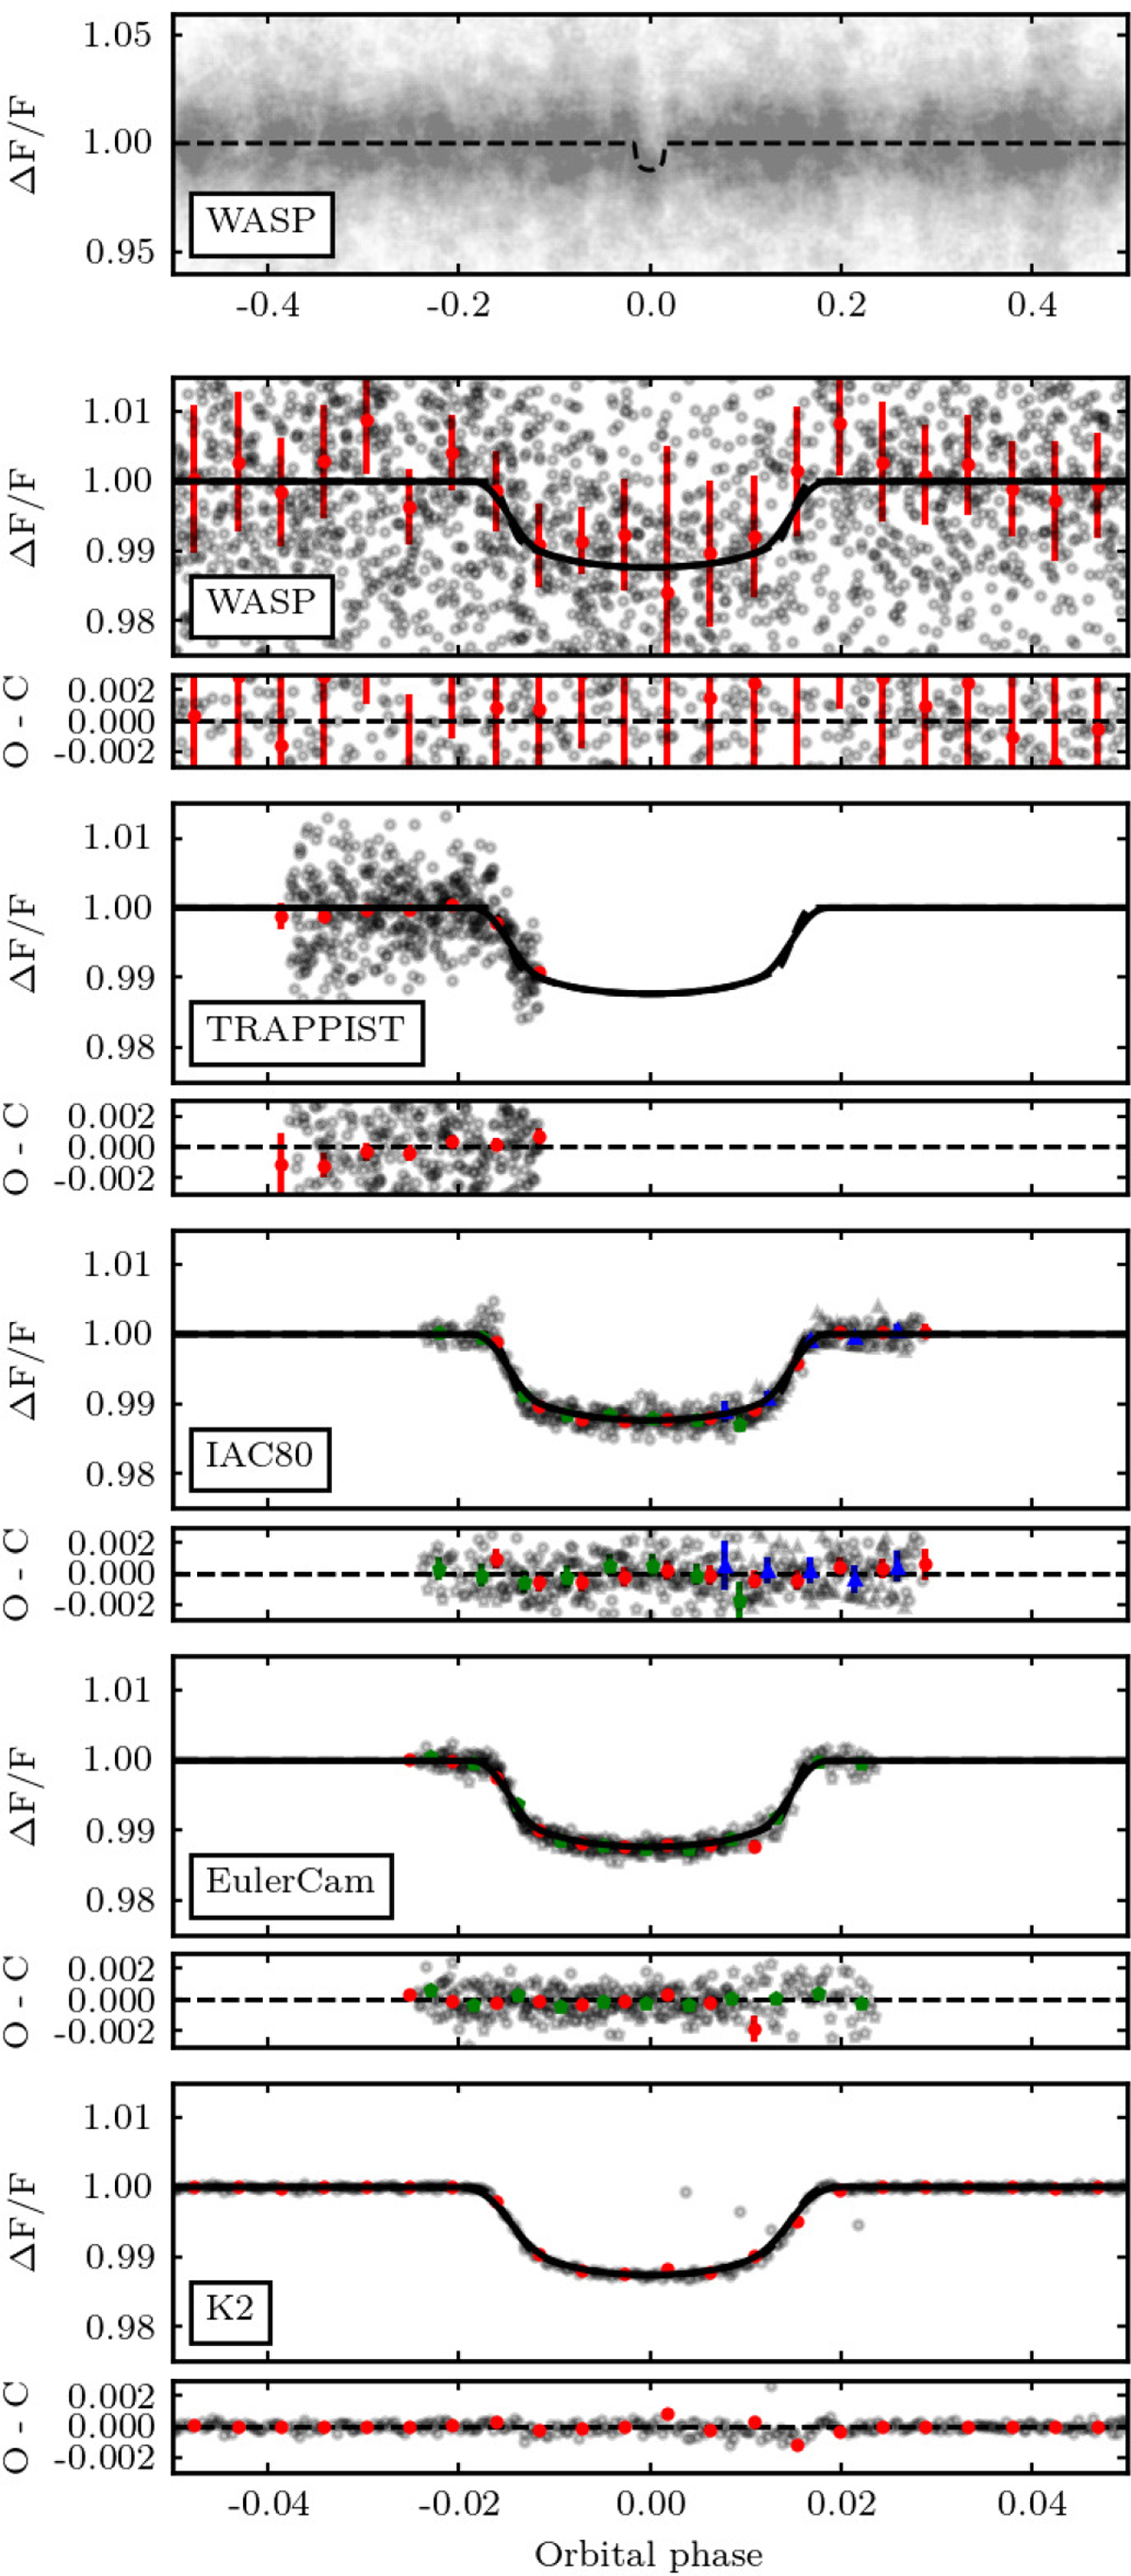
Photometry of WASP-151. The black or gray points are the data points at the original cadence of the observations, displayed without error bars for clarity. The red points corresponds to the same data points binned in phase with a bin width equivalent to 29.424 min (Kepler long cadence). These points are represented with their associated 1σ error bars. The black dashed and solid lines correspond to the best-fit model at the original and binned cadence respectively.When several datasets have been gathered with the same instrument, they are displayed on the same figure but with different symbols and colors. September EulerCam and IAC80 data are red dots, October EulerCam and first part of the November IAC80 data are green pentagons, and second part of the November IAC80 data are blue triangles.
Current usage metrics show cumulative count of Article Views (full-text article views including HTML views, PDF and ePub downloads, according to the available data) and Abstracts Views on Vision4Press platform.
Data correspond to usage on the plateform after 2015. The current usage metrics is available 48-96 hours after online publication and is updated daily on week days.
Initial download of the metrics may take a while.