Fig. 1
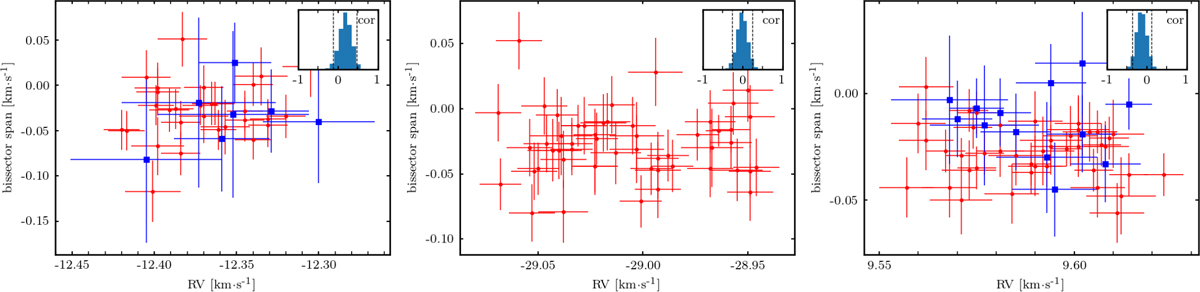
Bisector span as a function of the radial velocities with 1σ error bars forWASP-151, 153 and 156 (from left to right). SOPHIE data are the red circles; CORALIE data are the blue squares. The ranges here have the same extents in the x- and y-axes. For each star, the posterior probability function of the correlation coefficient is displayed in an insert located in the upper left corner.
Current usage metrics show cumulative count of Article Views (full-text article views including HTML views, PDF and ePub downloads, according to the available data) and Abstracts Views on Vision4Press platform.
Data correspond to usage on the plateform after 2015. The current usage metrics is available 48-96 hours after online publication and is updated daily on week days.
Initial download of the metrics may take a while.