Fig. 7
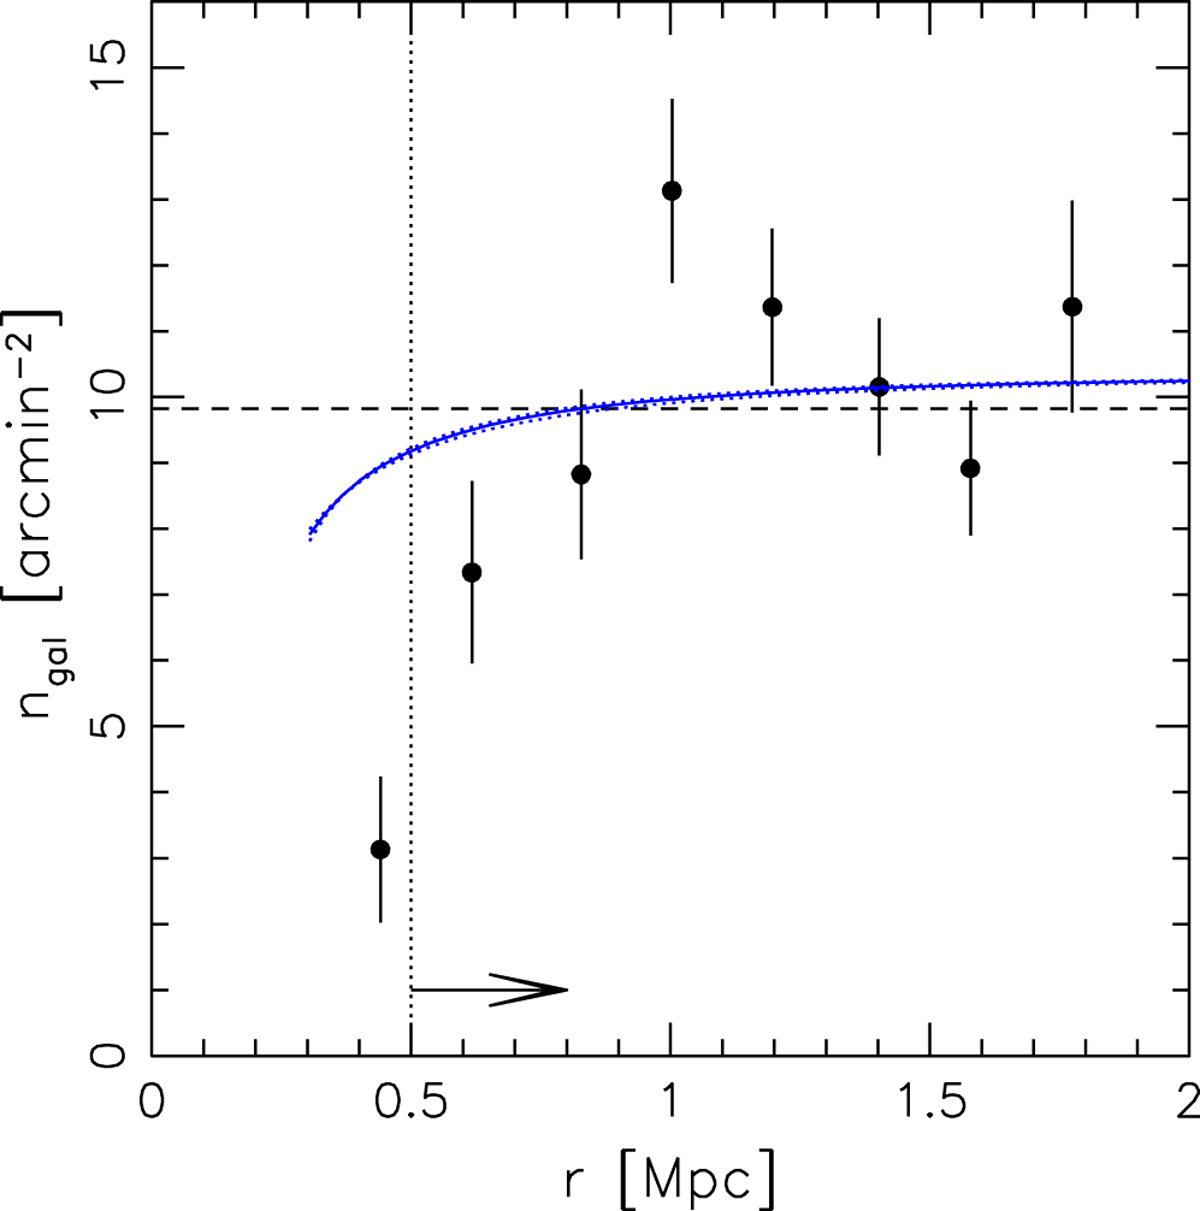
Source density in our colour- and magnitude-selected weak lensing source catalogue for RCS2 J2327 as a function of projected distance from the cluster centre, taking field boundaries, manual masks, and a bright objects mask into account. Error bars are underestimated, as they assume Poisson galaxy counts ignoring spatial clustering. The dashed black line indicates the average density over the whole field of view, while the blue curves indicate the approximately expected profile due to lensing magnification assuming the best-fitting NFW model for c200c = 5.1 (solid) or c200cϵ[4.1, 6.1] (dotted, close to the solid curve). The vertical black dotted line and the arrow indicate the lower radial limit in the weak lensing shear profile fit.
Current usage metrics show cumulative count of Article Views (full-text article views including HTML views, PDF and ePub downloads, according to the available data) and Abstracts Views on Vision4Press platform.
Data correspond to usage on the plateform after 2015. The current usage metrics is available 48-96 hours after online publication and is updated daily on week days.
Initial download of the metrics may take a while.