Fig. 4
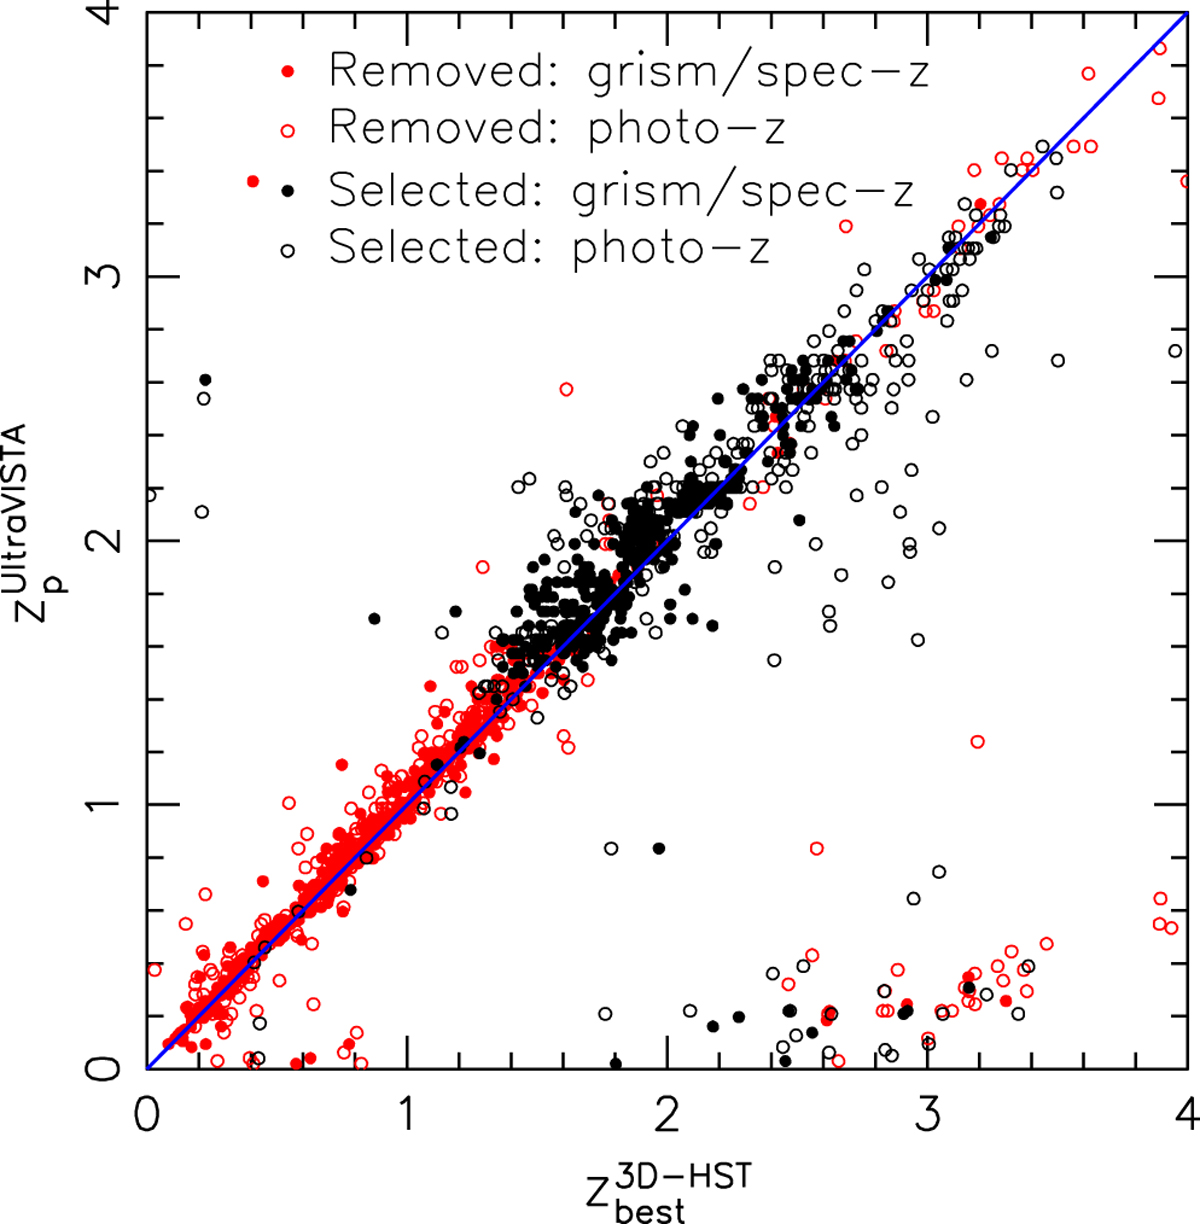
Comparison of the best redshift estimate zbest from 3D-HST and the peak photometric redshift zp in the UltraVISTA-detected catalogue for galaxies located in the area covered by the grism observations with ![]() . Galaxies with a spectroscopic or grism redshift in the 3D-HST catalogue are indicated as filled circles, while the galaxies having a photometric redshift in the 3D-HST catalogue only are shown as open circles. Black symbols correspond to galaxies passing our colour selection, while red symbols show galaxies removed by the colour selection. The blue line shows the one-to-one relation.
. Galaxies with a spectroscopic or grism redshift in the 3D-HST catalogue are indicated as filled circles, while the galaxies having a photometric redshift in the 3D-HST catalogue only are shown as open circles. Black symbols correspond to galaxies passing our colour selection, while red symbols show galaxies removed by the colour selection. The blue line shows the one-to-one relation.
Current usage metrics show cumulative count of Article Views (full-text article views including HTML views, PDF and ePub downloads, according to the available data) and Abstracts Views on Vision4Press platform.
Data correspond to usage on the plateform after 2015. The current usage metrics is available 48-96 hours after online publication and is updated daily on week days.
Initial download of the metrics may take a while.