Fig. 12
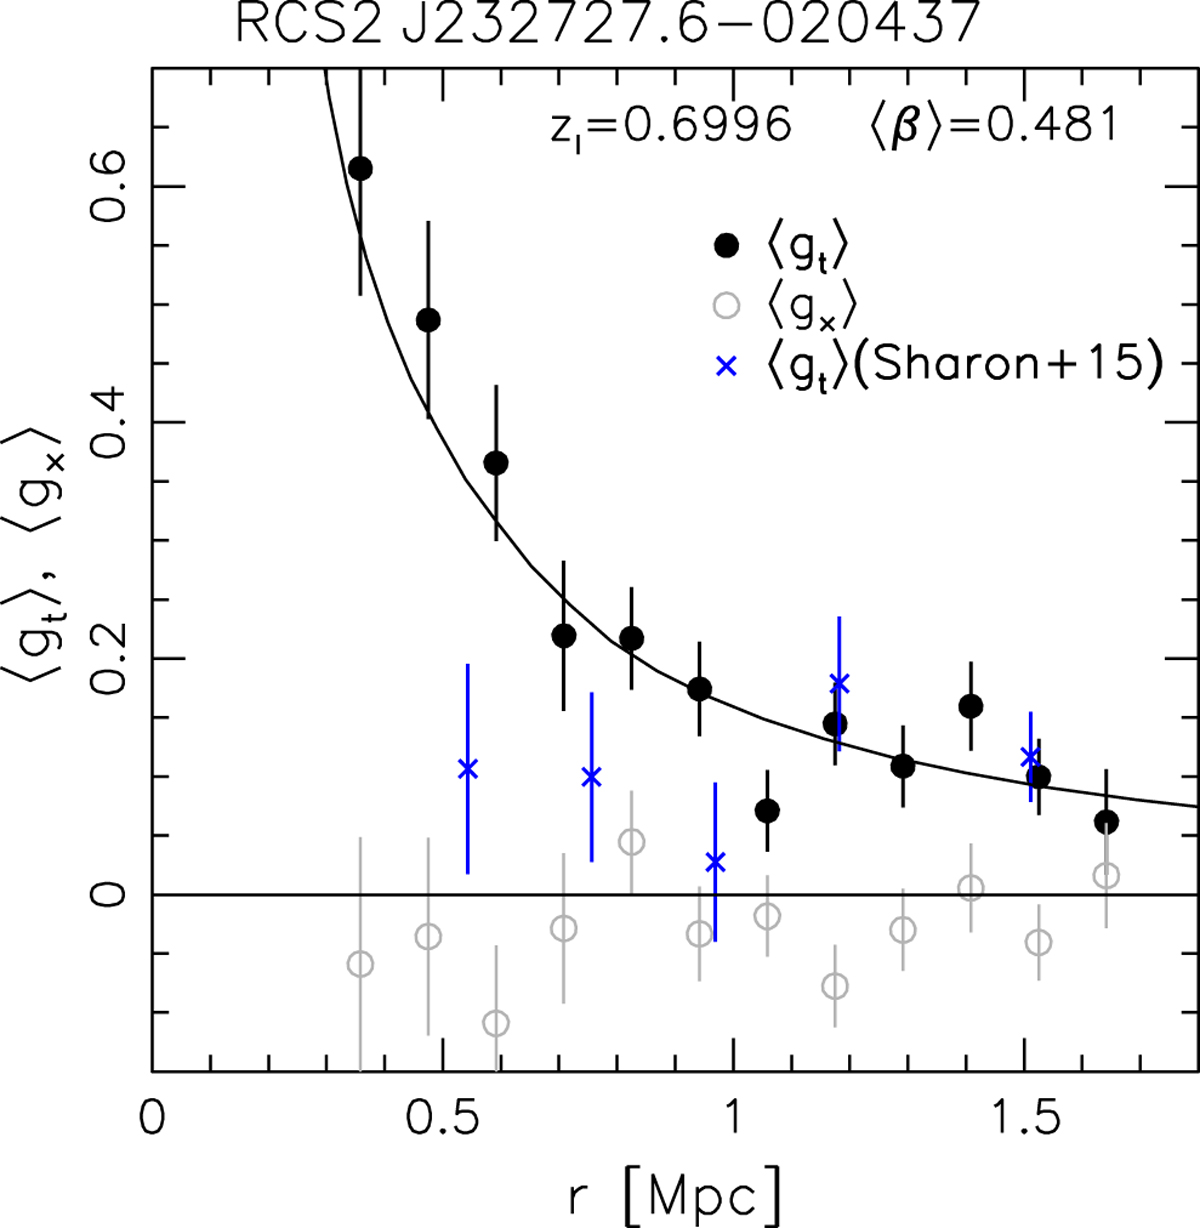
Profile of the tangential reduced shear (filled circles) and the 45 degrees-rotated cross-component (open circles) for RCS2 J2327 as function of cluster-centric separation. The solid curve shows the best-fitting NFW model prediction for a fixed concentration c200c = 5.1 when considering scales 500 kpc < r < 1.6 Mpc. The blue crosses indicate tangential reduced shear estimates from Sharon et al. (2015) based on deep CFHT weak lensing measurements, scaled to the same ⟨β⟩ and excluding points at small radii that are not included in their fit. Sharon et al. (2015) also incorporate measurements at larger radii that are not shown here.
Current usage metrics show cumulative count of Article Views (full-text article views including HTML views, PDF and ePub downloads, according to the available data) and Abstracts Views on Vision4Press platform.
Data correspond to usage on the plateform after 2015. The current usage metrics is available 48-96 hours after online publication and is updated daily on week days.
Initial download of the metrics may take a while.