Fig. 10
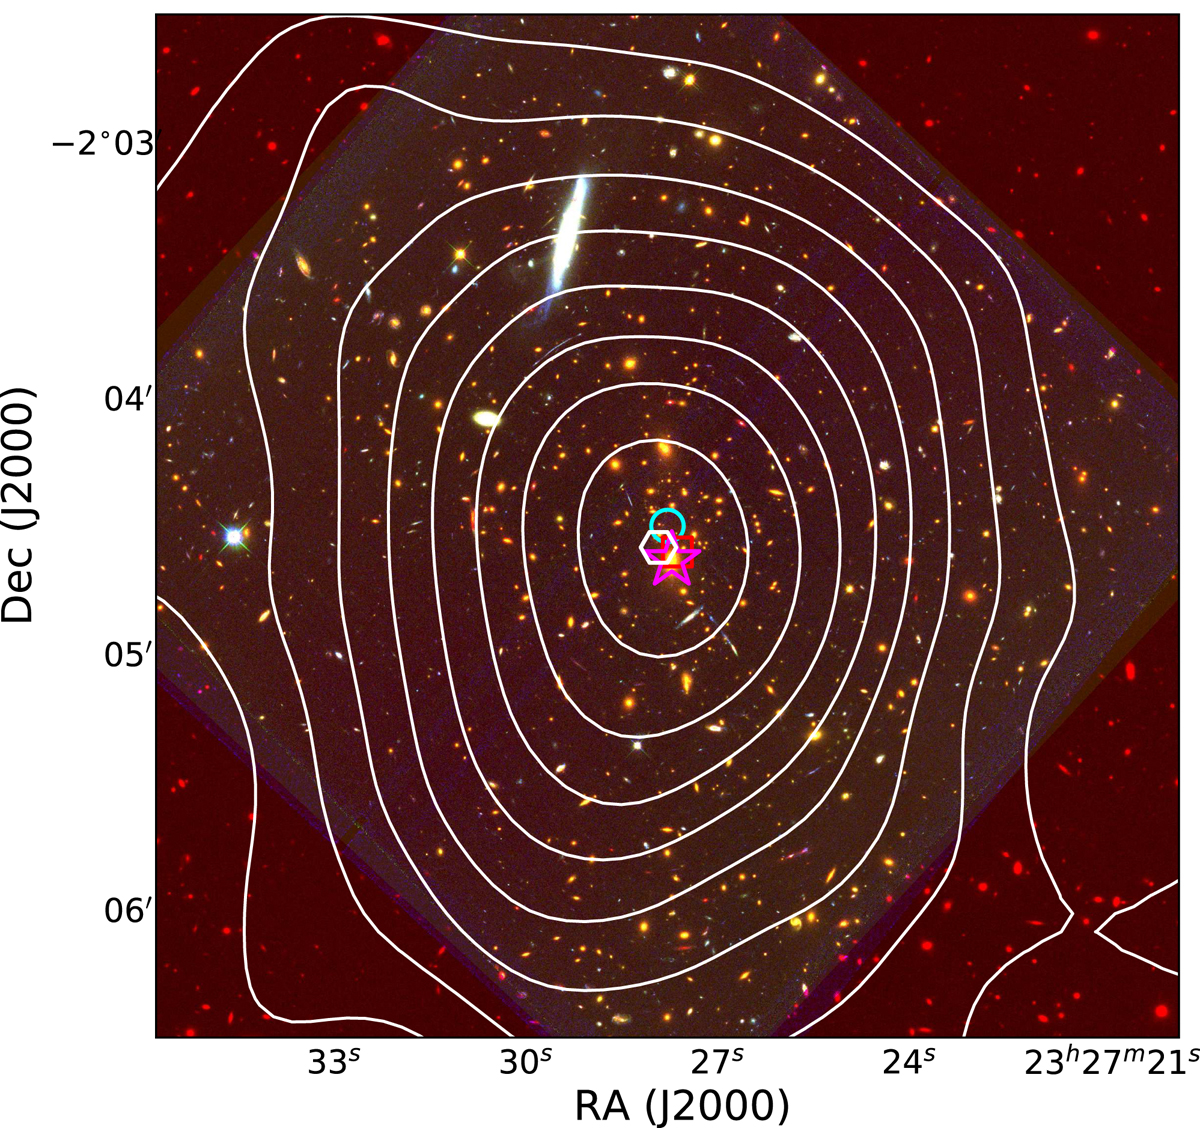
RGB colour image of the central 4′ × 4′ of RCS2 J2327 created from the VLT/HAWK-I Ks best-seeing stack and the HST/ACS F814W and F435W images. The contours indicate the weak lensing convergence reconstruction starting at κ0 = 0.04 in steps of Δκ = 0.04 with the peak indicated by the white hexagon. The magenta star, red square, and cyan circle indicate the locations of the BCG, the peak in the X-ray emission, and the strong lensing centre from Sharon et al. (2015), respectively.
Current usage metrics show cumulative count of Article Views (full-text article views including HTML views, PDF and ePub downloads, according to the available data) and Abstracts Views on Vision4Press platform.
Data correspond to usage on the plateform after 2015. The current usage metrics is available 48-96 hours after online publication and is updated daily on week days.
Initial download of the metrics may take a while.