Fig. 4
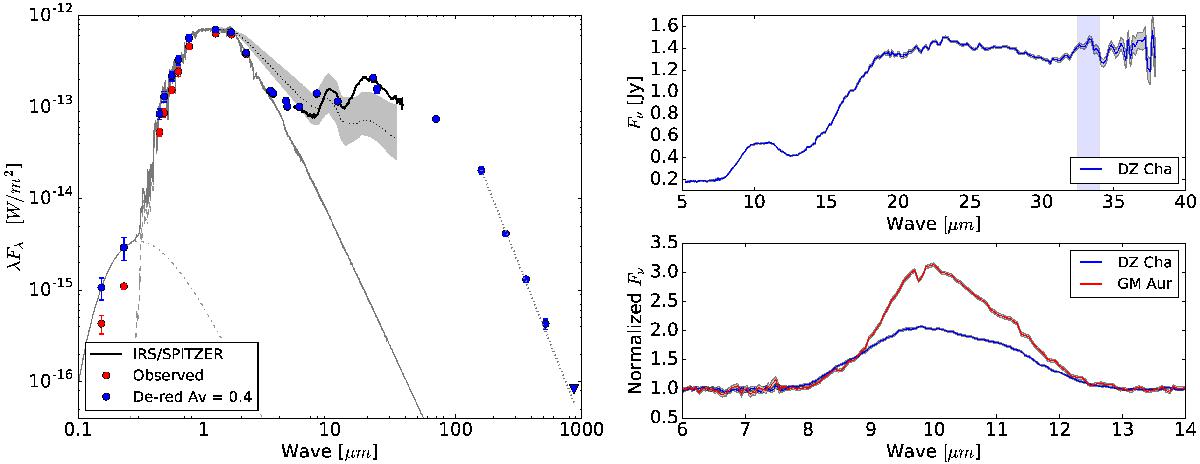
Left: SED. The solid grey line shows the combination of a 12 000 K black body (dot-dashed line) with the photosphere model (dashed line, see Sect. 3.1). The dotted black line and the grey shadowed region trace the median SED and upper/lower quartiles of Class II discs around K2-M5 stars in Taurus (Furlan et al. 2006). The dotted grey line shows the power-law fit Fν ∝ να, with α = 2.5 ± 0.1 (see Sect. 3.2). Top right: IRS/Spitzer spectra. The light blue rectangle is centred around the 33.8 μm crystalline silicate feature, and the grey shadowed region indicates the spectra uncertainties. Bottom right: de-redened and normalized 10 μm profile of DZ Cha and GM Aur.
Current usage metrics show cumulative count of Article Views (full-text article views including HTML views, PDF and ePub downloads, according to the available data) and Abstracts Views on Vision4Press platform.
Data correspond to usage on the plateform after 2015. The current usage metrics is available 48-96 hours after online publication and is updated daily on week days.
Initial download of the metrics may take a while.