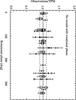
Fig. 15
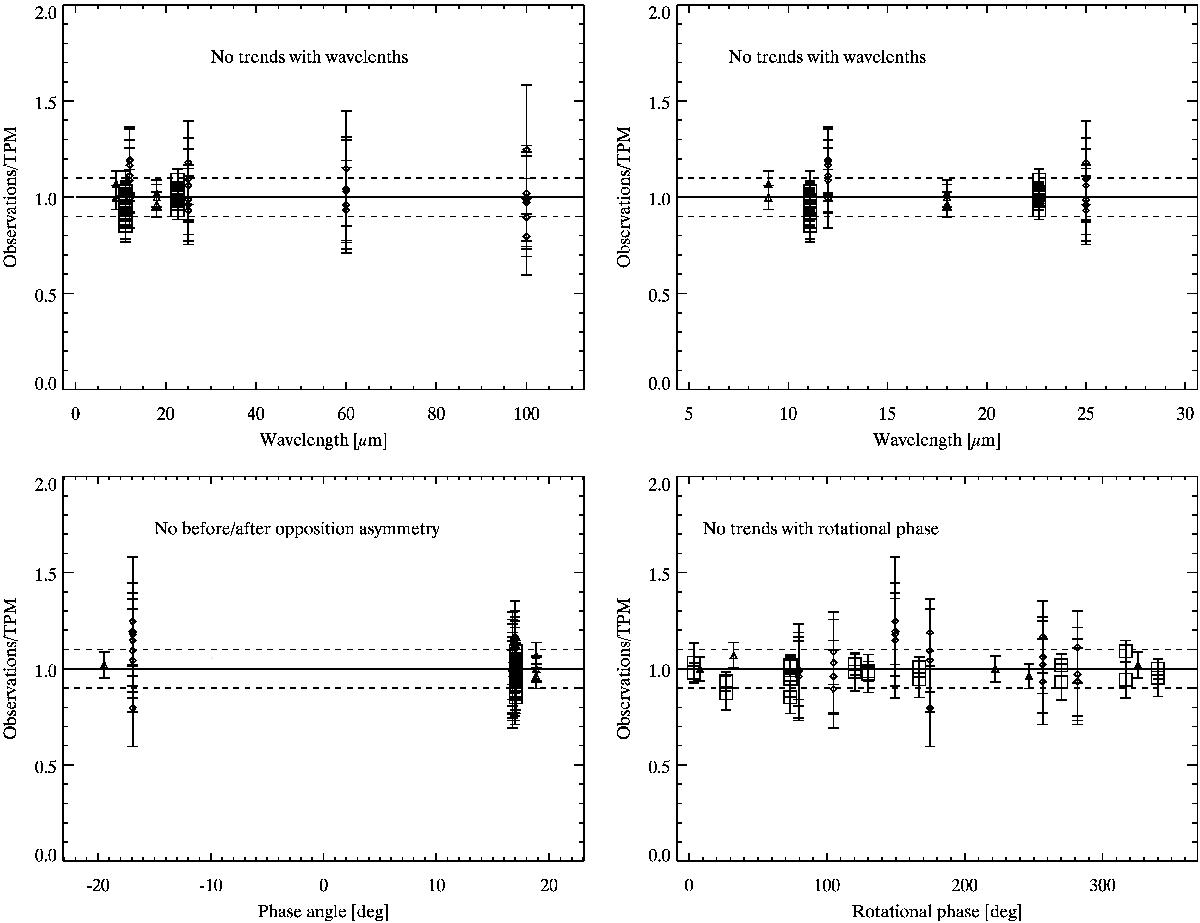
O–C diagrams for the thermophysical model of (159) Aemilia using SAGE model 1. They illustrate how well the spin/shape model works against thermal infrared data. The dashed lines indicate +/–10% in the observation-to-model ratio, which corresponds to typical flux errors of thermal measurements. There are no trends with wavelength, rotation, or pre- and post-opposition asymmetry. For the best fitting thermal parameters see Table 7. Triangles: data from AKARI, squares: WISE W3/W4, small diamonds: IRAS.
Current usage metrics show cumulative count of Article Views (full-text article views including HTML views, PDF and ePub downloads, according to the available data) and Abstracts Views on Vision4Press platform.
Data correspond to usage on the plateform after 2015. The current usage metrics is available 48-96 hours after online publication and is updated daily on week days.
Initial download of the metrics may take a while.