Free Access
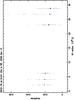
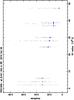
Fig. 3

8.4 GHz visibility amplitude versus (u,v)-distance plot, showing the measured visibilities (gray) in the single-scan observations of 0943–761 (top) in 2009.95 and of 1409–651 (Circinus galaxy; bottom) in 2010.82. The data are averaged over 32 s. A simple two-dimensional Gaussian model (blue) is shown overlaid on the data.
This figure is made of several images, please see below:
Current usage metrics show cumulative count of Article Views (full-text article views including HTML views, PDF and ePub downloads, according to the available data) and Abstracts Views on Vision4Press platform.
Data correspond to usage on the plateform after 2015. The current usage metrics is available 48-96 hours after online publication and is updated daily on week days.
Initial download of the metrics may take a while.