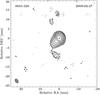
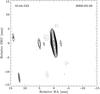
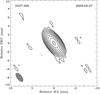
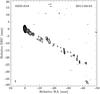
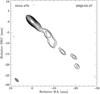
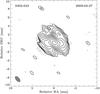
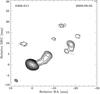
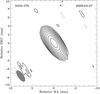
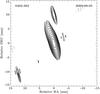
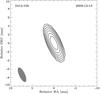
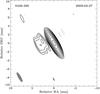
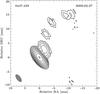
Fig. 2

First epoch 8.4 GHz clean images of additional TANAMI sources. The black contours indicate the flux density level (dashed gray contours are negative), scaled logarithmically and separated by a factor of 2, with the lowest level set to the 3σ noise level (for more details see Table A.2). The size of the synthesized beam for each observation is shown as a gray ellipse in the lower left corner of each image. The IAU B1950 name and the date of the observing epoch is given in the upper left and right corner, respectively. Additional images in Fig. A.1.
Current usage metrics show cumulative count of Article Views (full-text article views including HTML views, PDF and ePub downloads, according to the available data) and Abstracts Views on Vision4Press platform.
Data correspond to usage on the plateform after 2015. The current usage metrics is available 48-96 hours after online publication and is updated daily on week days.
Initial download of the metrics may take a while.