Fig. 5
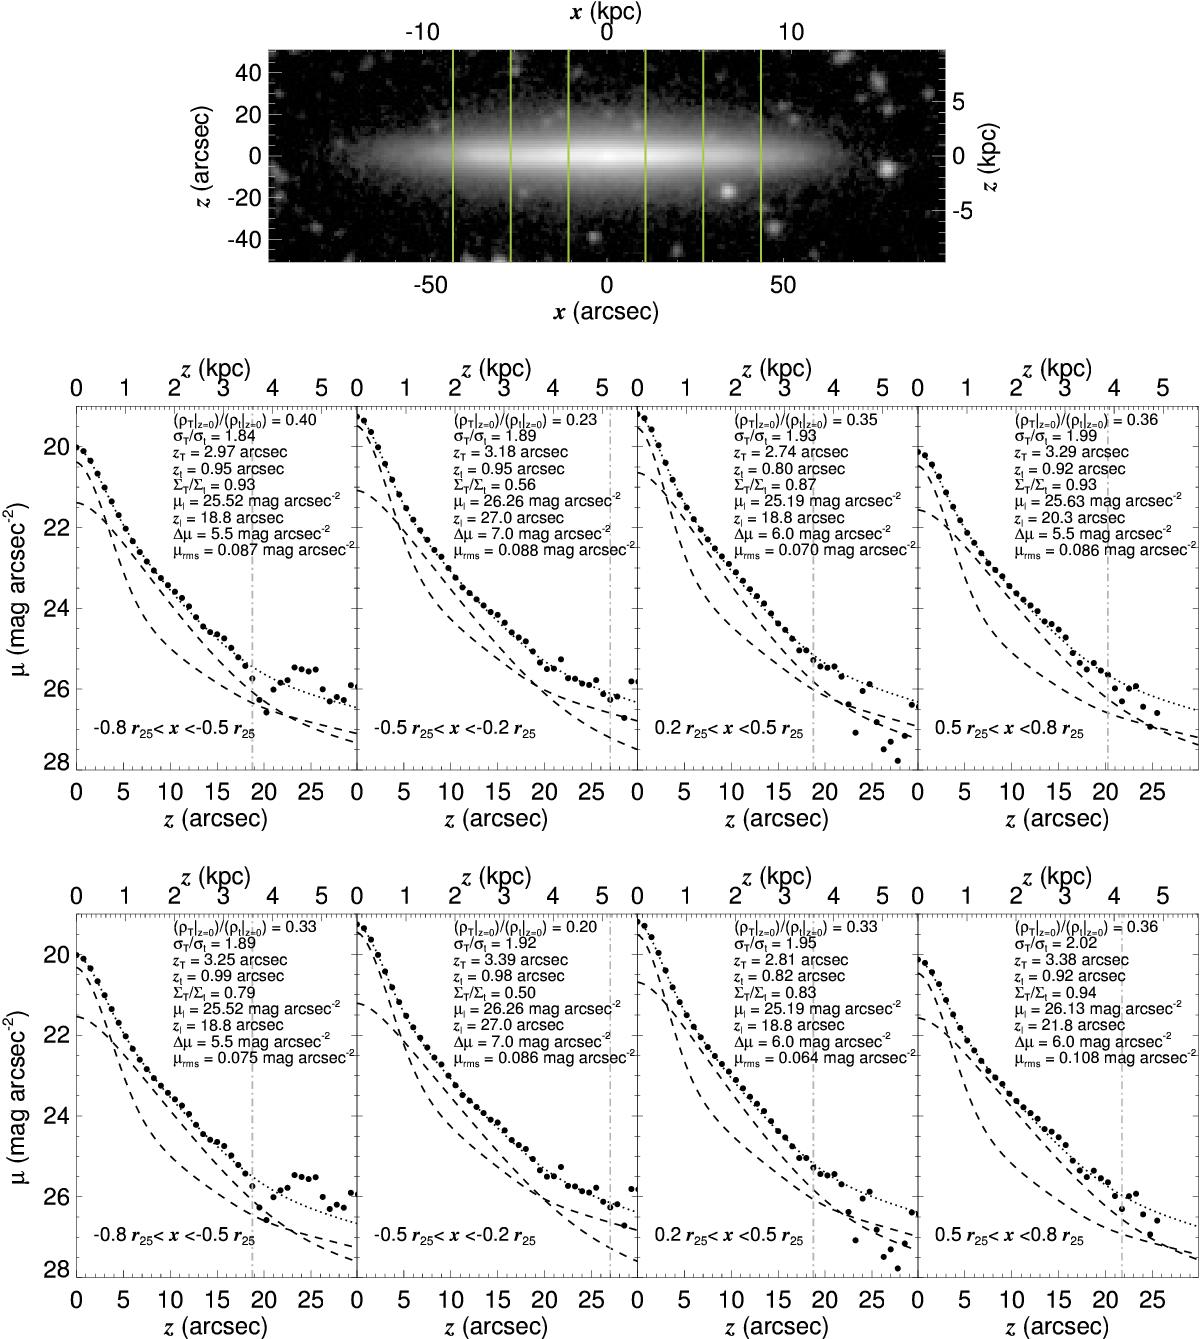
Top panel: 3.6 μm image of ESO 533-4. The four axial bins for which surface-brightness profiles were produced are marked with vertical green lines. Middle panels: surface-brightness profiles of the four bins (large filled circles) and fits produced as explained in Sect. 3.2.6 incorporating full PSF treatment (dotted lines). The dashed lines indicate the thin and thick disc contributions. The vertical dot-dashed grey lines indicate the range of heights considered for each fit. Each of the middle panels contains some of the data obtained from the fits: the fitted parameters (![]() and σT/σt), the scale-heights of the thick and the thin discs (zT and zt, respectively), the thick to thin disc mass ratio in that bin (ΣT/ Σt), the faintest surface brightness level that was considered for the fit (μl), the maximum height considered for the fit (zl), the dynamic range of the fit (Δμ), and the root mean square deviation of the fit (μrms). Bottom panels: same as for the middle panels but this time with the fitting procedure explained in Sect. 3.4 accounting for the presence of the CMC. For this galaxy the CMC contribution is so small that it falls below the μ = 28 mag arcsec-2 level.
and σT/σt), the scale-heights of the thick and the thin discs (zT and zt, respectively), the thick to thin disc mass ratio in that bin (ΣT/ Σt), the faintest surface brightness level that was considered for the fit (μl), the maximum height considered for the fit (zl), the dynamic range of the fit (Δμ), and the root mean square deviation of the fit (μrms). Bottom panels: same as for the middle panels but this time with the fitting procedure explained in Sect. 3.4 accounting for the presence of the CMC. For this galaxy the CMC contribution is so small that it falls below the μ = 28 mag arcsec-2 level.
Current usage metrics show cumulative count of Article Views (full-text article views including HTML views, PDF and ePub downloads, according to the available data) and Abstracts Views on Vision4Press platform.
Data correspond to usage on the plateform after 2015. The current usage metrics is available 48-96 hours after online publication and is updated daily on week days.
Initial download of the metrics may take a while.