Fig. 15
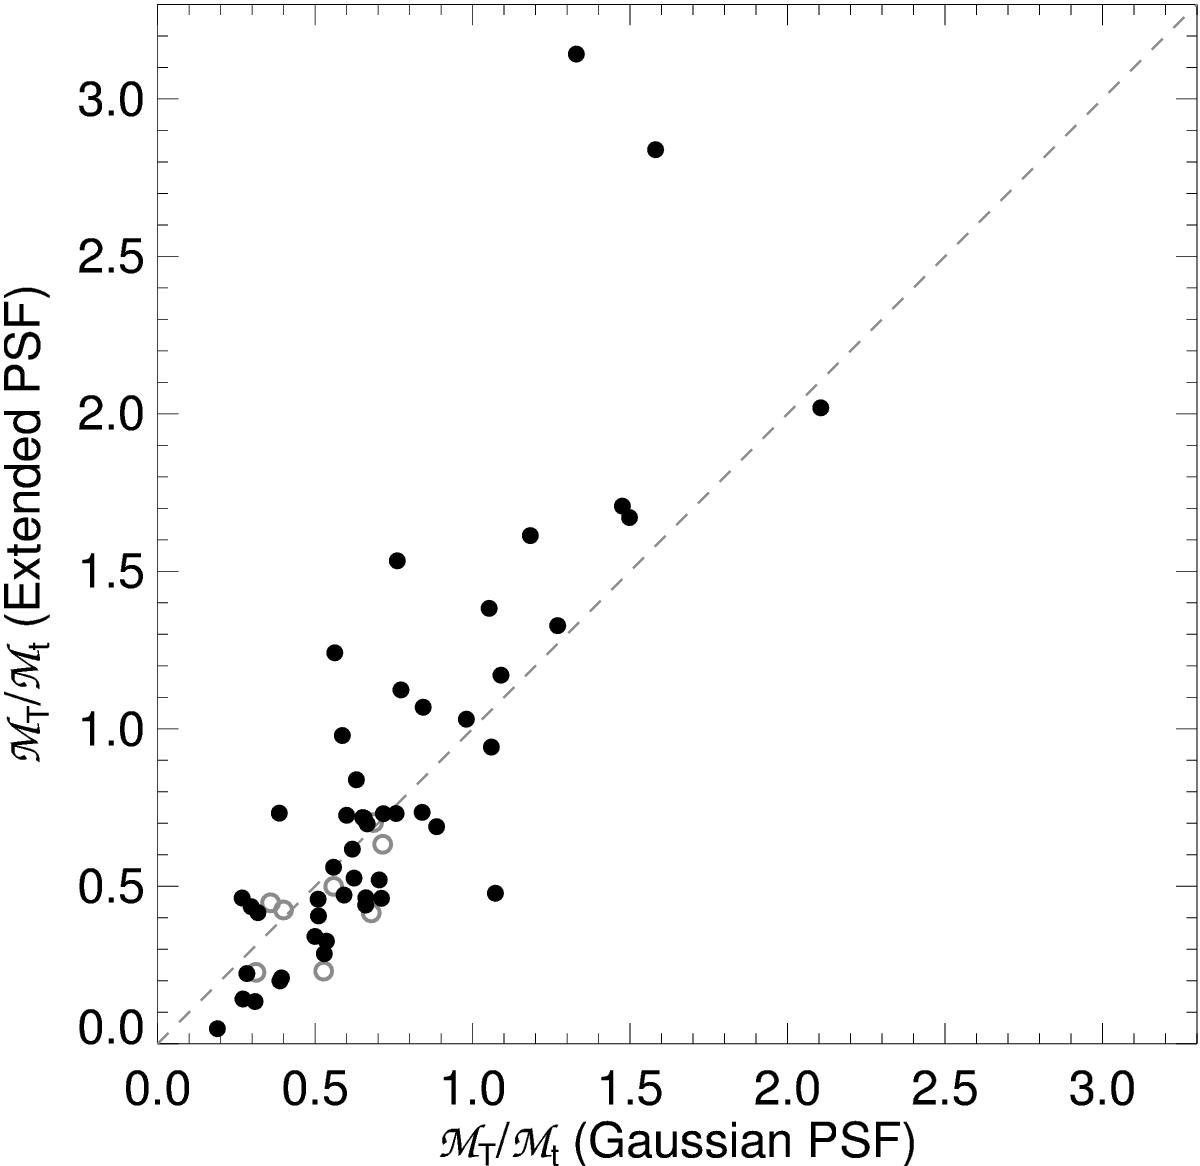
Comparison of the thick to thin disc mass ratios – ℳT/ ℳt – calculated with a Gaussian PSF (Comerón et al. 2012, 2014) and those calculated (this paper) with the symmetrised version of the PSF provided by Hora et al. (2012). The grey line indicates a one-to-one correlation. Filled black dots correspond to gas-rich galaxies, and grey circles correspond to gas-poor galaxies.
Current usage metrics show cumulative count of Article Views (full-text article views including HTML views, PDF and ePub downloads, according to the available data) and Abstracts Views on Vision4Press platform.
Data correspond to usage on the plateform after 2015. The current usage metrics is available 48-96 hours after online publication and is updated daily on week days.
Initial download of the metrics may take a while.