Fig. 12
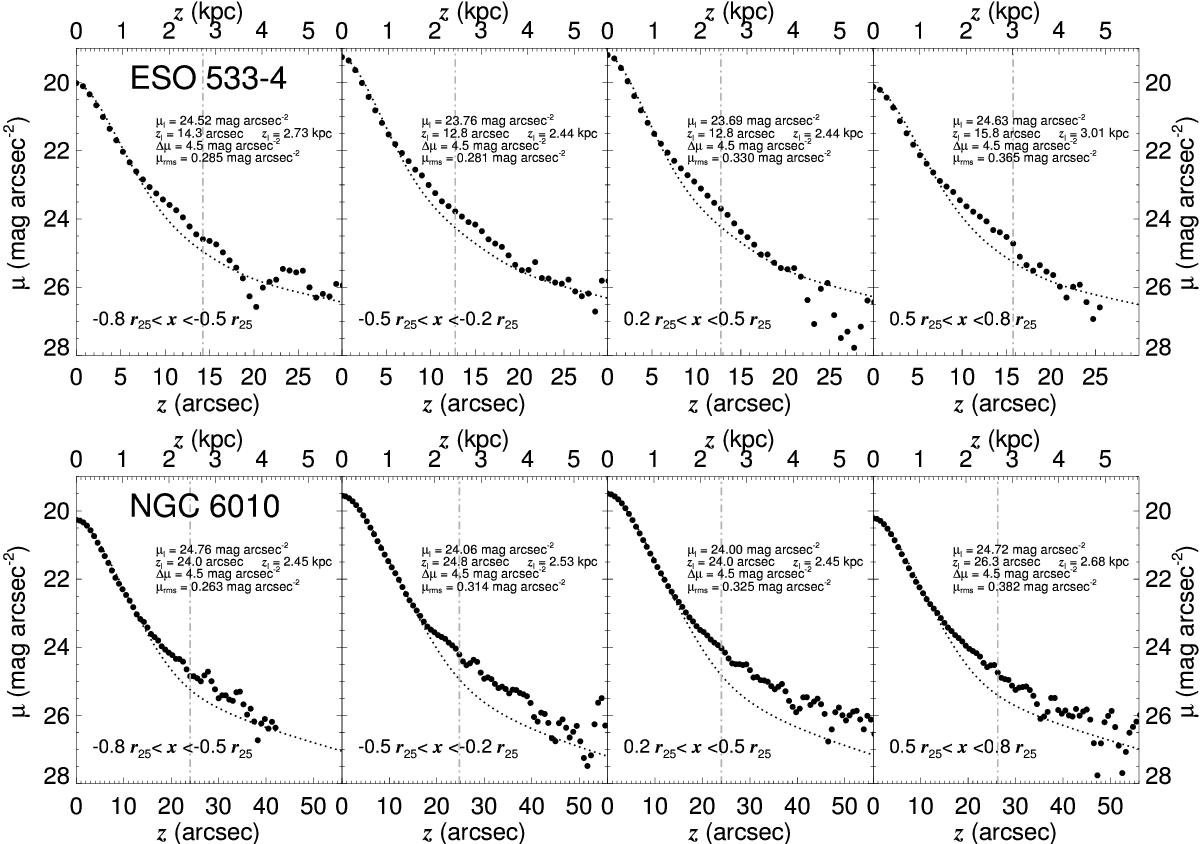
Top: surface-brightness profiles of the four axial bins of ESO 533-4 (large filled circles) and fits produced with a single disc component (dotted lines). The vertical dot-dashed grey lines indicate the range of heights considered for each fit. Each of the panels contains some information about the fits: the faintest surface-brightness level that was considered for the fit (μl), the maximum height considered for the fit (zl), the dynamic range of the fit (Δμ), and the root mean square deviation of the fit (μrms). Bottom: same as the top but for NGC 6010.
Current usage metrics show cumulative count of Article Views (full-text article views including HTML views, PDF and ePub downloads, according to the available data) and Abstracts Views on Vision4Press platform.
Data correspond to usage on the plateform after 2015. The current usage metrics is available 48-96 hours after online publication and is updated daily on week days.
Initial download of the metrics may take a while.